August Producer Price Index Sets New YoY Record Increases
August Producer Price Index Sets New YoY Record Increases for Final Demand Goods, Final Demand Services, and a 46 year High for Prices of Intermediate Goods; MarketWatch 666, Commenter RJS
The seasonally adjusted Producer Price Index (PPI) for final demand rose 0.7% in August, as prices for finished wholesale goods rose 1.0% while margins of final services providers rose 0.7% . . . that increase followed a July report that indicated the PPI was 1.0% higher, as prices for finished wholesale goods rose 0.6% while margins of final services providers rose 1.1%, a June report that also had the PPI 1.0% higher, but with prices for finished wholesale goods 1.2% higher while margins of final services providers rose 0.8%, a now revised May report that the PPI had risen 0.5%, as prices for finished wholesale goods rose 1.3% while margins of final services providers rose 0.1%, and a rerevised April report that the PPI was 1.0% higher, as prices for finished wholesale goods rose 0.7% while margins of final services providers rose by 1.2% . . . on an unadjusted basis, producer prices are now a record 8.3% higher than a year ago, up from the 7.8% year over year increase reported for July’s producer prices, while the core producer price index, which excludes food, energy and trade services, rose by 0.3% for the month, and is now 6.3% higher than in August a year ago, up from the 6.1% year over year increase that was shown in July…
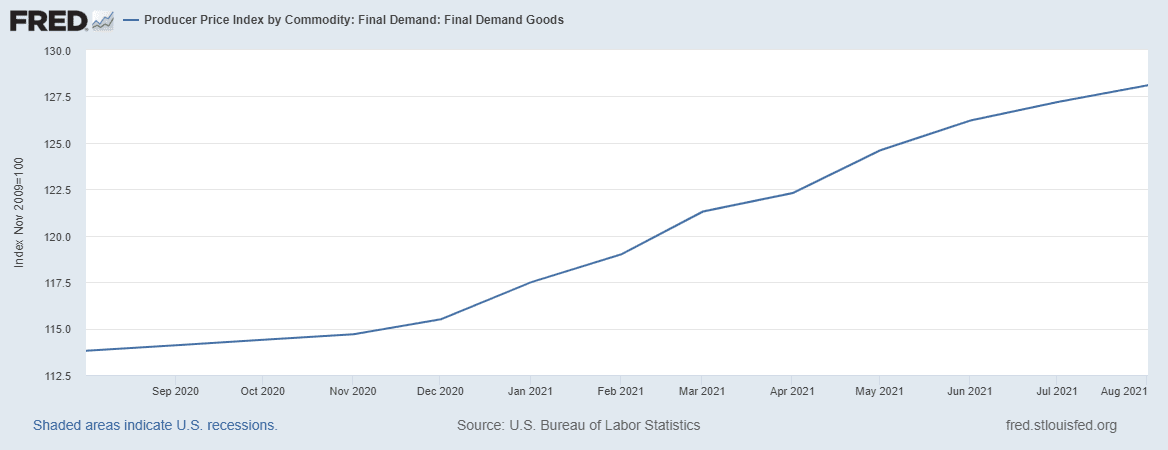
As noted, the price index for final demand for goods, aka ‘finished goods’, was 1.0% higher in August, after being 0.6% higher in July. 1.2% higher in June, 1.3% higher in May, 0.7% higher in April, 1.5% higher in March, 1.6% higher in February, 1.6% higher in January, 0.9% higher in December, 0.4% higher in November, 0.5% higher in October, 0.4% higher in September, and 0.4% higher in August of last year, and hence is now up by a record 12.6% from a year ago . . . the finished goods price index rose 1.0% in August as the price index for wholesale foods rose 2.9%, after falling 2.1% in July, rising by 0.8% in June, rising 2.8% in May, by 1.8% in April, by 0.6% in March, by 1.4% in February, and by 1.6% in January, and as the price index for wholesale energy goods was 0.4% higher, after it had risen by 2.6% in July, by 2.1% in June, and by 1.4% in May, after falling 1.2% in April and rising 5.0% in March, by 6.2% in February, and by 5.1% in January . . . meanwhile, the index for final demand for core wholesale goods (excluding food and energy) was 0.6% higher in August, after it had risen by 1.0% in each of the prior four months . . . wholesale energy prices averaged 0.4% higher despite a 0.3% decrease in wholesale prices for gasoline, due to a 5.6% increase in wholesale prices for residential natural gas and a 4.4% increase in wholesale prices for LP gas, while the wholesale food price index rose 2.6% on a 14.7% increase in the wholesale price index for beef and veal, a 6.0% increase in the wholesale price index for processed chickens, and a 16.0% increase in wholesale price index for fresh and dry vegetables . . . among core wholesale goods, the wholesale price index for industrial chemicals rose 4.9%, the wholesale price index for truck trailers rose 2.6%, the wholesale price index for printing machinery and equipment rose 2.5%, the wholesale price index for home electronic equipment rose 3.1%, and the wholesale price index for toys, games, and children’s vehicles rose 2.0% . . .

At the same time, the index for final demand for services rose 0.7% in August, after rising 1.1% in July, 0.6% in June, a revised 0.1% in May, a revised 1.2% in April, and 0.3% in March, 0.3% in February and 1.0% in January, and is now up by a record 6.4% from a year ago, as the index for final demand for trade services rose 1.5%, the index for final demand for transportation and warehousing services rose 2.8%, and the core index for final demand for services less trade, transportation, and warehousing services was 0.1% higher . . . among trade services, seasonally adjusted margins for health, beauty, and optical goods retailers rose 7.8%, margins for TV, video, and photographic equipment and supplies retailers rose 3.9%, margins for furnishings wholesalers rose 5.2%, and margins for sporting goods and boat retailers rose 9.0%, while margins for hardware, building materials, and supplies retailers fell 11.6%…among transportation and warehousing services, average margins for air transportation of freight rose 1.1% and margins for airline passenger services rose 8.9% . . . among the components of the core final demand for services index, the price index for bundled wired telecommunications access services rose 4.7%, the price index for tax preparation and planning rose 2.1%, the price index for food and beverages for immediate consumption rose 1.6%, and the price index for traveler accommodation services rose 2.6%, while index for securities brokerage, dealing, investment advice, and related services fell 3.1% and the price index for hospital outpatient care fell 1.5 % …
This report also showed the price index for intermediate processed goods rose 1.0% in August, after rising 1.7% in July, 1.9% in June, a revised 2.5% in May, a revised 1.9% in April, 3.5% in March, 2.9% in February, and 1.8% in January, 1.4% in December, 0.9% in November, 0.9% in October, 0.6% in September, and 0.9% in August of last year . . . the price index for intermediate energy goods rose fell 0.6% in August, as refinery prices for jet fuel fell 2.0%, refinery prices for fuel oil fell 1.6%, refinery prices for gasoline fell 0.3%, and producer prices for natural gas to electric utilities fell 3.1%, while producer prices for industrial natural gas rose 7.2% . . . meanwhile, the price index for intermediate processed foods and feeds rose 2.1%, as the producer price index for meats rose 8.5%, the producer price index for processed poultry rose 3.7%, and the producer price index for fats and oils rose 2.7%…at the same time, the core price index for intermediate processed goods less food and energy goods rose 1.3%, as the producer price index for synthetic rubber rose 5.9%, the producer price index for steel mill products rose 5.1%, the producer price index for aluminum mill shape rose 3.7%, the producer price index for plastic construction products rose 3.0%, the producer price index for basic organic chemicals rose 5.3%, the producer price index for nitrogenates rose 4.1%, and the producer price index for fabricated structural metal products rose 3.3%, while the producer price for softwood lumber fell 27.7% . . . average prices for intermediate processed goods are now 23.0% higher than in August a year ago, the largest year over year price increase since the year ended February 1975, but just the ninth increase after 19 consecutive year over year decreases, which had followed 29 months of year over year increases, which had been preceded by 16 months of negative year over year comparisons, as prices for intermediate goods fell every month from July 2015 through March 2016 . . .
Meanwhile, the price index for intermediate unprocessed goods rose rose 1.0% in August, after rising 1.4% in July, 2.6% in June, a revised 7.3% in May, and a revised 2.0% in April, after falling by 4.2% in March, rising 11.9% in February, and rising by 5.3% in January, 2.1% in December, by 6.3% in November, 1.3% in October, 5.2% in September, and by 4.0% last August . . . that was as the August price index for crude energy goods fell 0.2% as crude oil prices fell 10.1%, unprocessed natural gas prices rose 13.4%, and coal prices fell 0.3%, while the price index for unprocessed foodstuffs and feedstuffs rose 3.8% on a 14.3% increase in producer prices for wheat, a 12.6% increase in producer prices for alfalfa hay, a 12,9% increase in producer prices for slaughter chickens, and a 4.9% increase in producer prices for corn…at the same time, the index for core raw materials other than food and energy materials was unchanged, as the price index for iron ore rose 1.5% and the price index for recyclable paper rose 3.7%, while the price index for copper base scrap fell 4.8% and the price index for iron and steel scrap fell 3.7% . . . this raw materials index is still 50.1% higher than a year ago, which is actually down from the 57.9% year over year increase recorded in May, but just the tenth year over year increase after the annual change on this index had been negative from the beginning of 2019 through October of last year…
Lastly, the price index for services for intermediate demand rose 0.3% in August, after rising 1.0% in July, 1.1% in June, a revised 0.2% in May, a revised 1.3% in April, and rising 0.6% in March, 0.3% in February, 1.1% in January, and 0.7% in December 2020, after being unchanged in November, rising 0.7% in October, rising 1.1% in September, and 0.8% last August . . . the price index for intermediate trade services was 1.1% higher, as margins for intermediate machinery and equipment parts and supplies wholesalers rose 2.8%, margins for intermediate metals, minerals, and ores wholesalers rose 6.8%, as margins for intermediate chemicals and chemical products wholesalers rose 3.4%, and margins for intermediate building materials, paint, and hardware wholesalers rose 5.7% . . . meanwhile, the index for transportation and warehousing services for intermediate demand was also 1.1% higher, as the intermediate price index for transportation of passengers rose 8.7%, the intermediate price index for water transportation of freight rose 1.3%, the intermediate price index for truck transportation of freight rose 0.9%, and the intermediate price index for air transportation of freight rose 1.1% . . . on the other hand, the core price index for intermediate services other than trade, transportation, and warehousing services fell 0.2%, as the intermediate price index for television advertising time sales fell 9.0%, the intermediate price index for securities brokerage, dealing, investment advice, and related services fell 3.1%, the intermediate price index for passenger car rental fell 3.1%, and the intermediate price index for cable and satellite subscriber services fell 2.5%, while the intermediate price index for bundled wired telecommunication access services rose 4.8%…over the 12 months ended in June, the year over year price index for services for intermediate demand is still 8.6% higher than it was a year ago, the eleventh consecutive positive annual change since it briefly turned negative year over year from April to August of last year, but down from the record 9.2% year over year increase recorded in July….