Construction Spending Fell 0.8% in February
Commenter RJS at MarketWatch 666
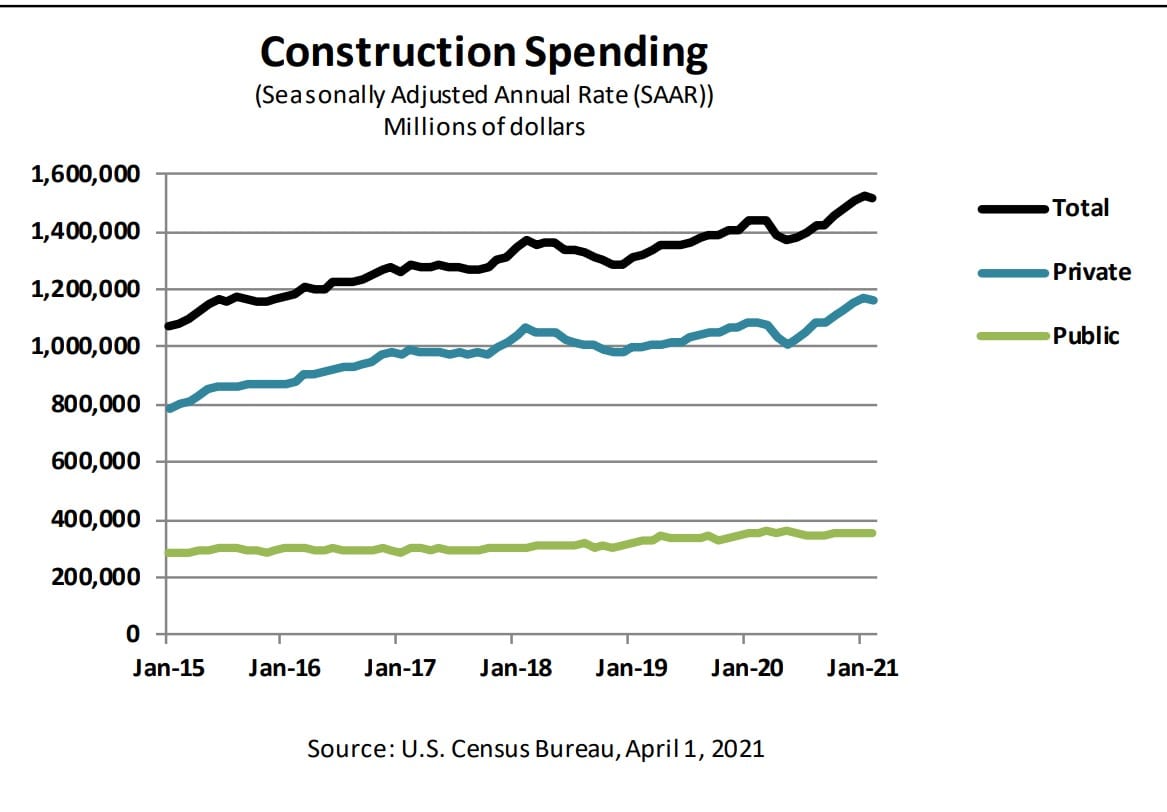
Construction Spending Fell 0.8% in February after January & December Figures Were Revised Higher
The Census Bureau’s report on February construction spending (pdf) reported that “Construction spending during February 2021 was estimated at a seasonally adjusted annual rate of $1,516.9 billion, 0.8 percent (±0.7 percent) below the revised January estimate of $1,529.0 billion. The February figure is 5.3 percent (±1.0 percent) above the February 2020 estimate of $1,441.1 billion. During the first two months of this year, construction spending amounted to $213.2 billion, 4.9 percent (±1.0 percent) above the $203.2 billion for the same period in 2020. “…the January annualized spending estimate was revised 0.5% higher, from the $1,521.5 billion reported a month ago to $1,529.0 billion, while December’s construction spending was revised from $1,496.5 billion to $1,510.4 billion annually, which together meant that the January construction spending increase was revised down from +1.7% to +1.2% . . . the $13.9 billion upward revision to December’s annualized spending would mean we’ll see a upward revision of about 12 basis points to 4th quarter GDP when the annual revisions are released later this summer . . .
A further breakdown of the different subsets of construction spending are provided in a Census summary, which precedes the detailed spreadsheets below:
- Private Construction: Spending on private construction was at a seasonally adjusted annual rate of $1,165.7 billion, 0.5 percent (±0.7 percent)* below the revised January estimate of $1,171.6 billion. Residential construction was at a seasonally adjusted annual rate of $717.9 billion in February, 0.2 percent (±1.3 percent)* below the revised January estimate of $719.3 billion. Nonresidential construction was at a seasonally adjusted annual rate of $447.8 billion in February, 1.0 percent (±0.7 percent) below the revised January estimate of $452.3 billion.
- Public Construction: In February, the estimated seasonally adjusted annual rate of public construction spending was $351.2 billion, 1.7 percent (±1.2 percent) below the revised January estimate of $357.4 billion. Educational construction was at a seasonally adjusted annual rate of $86.9 billion, 3.2 percent (±1.3 percent) below the revised January estimate of $89.8 billion. Highway construction was at a seasonally adjusted annual rate of $102.3 billion, 0.6 percent (±3.1 percent)* below the revised January estimate of $103.0 billion.
As you can tell from that summary, this construction spending data would input into 3 subcomponents of GDP; investment in private non-residential structures, investment in residential structures, and into government investment outlays, for both state and local and Federal governments . . . however, getting an accurate read on the impact of February’s construction spending reported in this release on 1st quarter GDP is difficult because all figures given here are in nominal dollars and as you know, data used to compute the change in GDP must be adjusted for changes in price to determine the actual change in construction put in place . . . there are multiple prices indexes for different types of construction listed in the National Income and Product Accounts Handbook, Chapter 6 (pdf), so in lieu of trying to adjust the figures for all of those types of construction separately, we’ve opted to just use the producer price index for final demand construction as an inexact shortcut to make the needed price adjustment and come up with an estimate . . .
That price index showed that aggregate construction costs were up 0.3% in February, after they had increased by 0.2% in January, and had been up by 0.1% in both December and in November…on that basis, we can estimate that February construction costs were about 0.5% more than those of December, roughly 0.6% more than those of November, and roughly 0.7% more than those of October, and of course 0.3% more than those of January . . . we then use those relative price change percentages to inflate the lower cost spending figures for each of the 4th quarter months vis a vis February, which is arithmetically the same as adjusting higher priced January and February construction spending downward, for purposes of comparison….this report gives annualized construction spending in millions of dollars for the 4th quarter months as $1,510,387 in December, $1,479,555 in November, and $1,458,989 in October, while annualized construction spending was at $1,516,927 in February and $1,528,954 in January….thus to compare January’s nominal construction spending of $1,384,486 and February’s figure of $1,366,697 to inflation adjusted figures of the fourth quarter, our formula becomes: ((1,516,927 + 1,528,954 * 1.003) / 2 ) / (( 1,510,387 * 1.005 + 1,479,555 * 1.006 + 1,458,989 * 1.007) / 3) = 1.022372, which tells us that real construction spending over January and February was up by 2.237% from that of the 4th quarter period, or up at a 9.25% annual rate…then, to figure the potential effect of that change on GDP, we take the difference between the 4th quarter inflation adjusted average and that of January’s & February’s adjusted spending as a fraction of 4th quarter GDP, and find that 1st quarter construction spending is rising at a rate that would add about 0.88 percentage points to 1st quarter GDP, an estimate which assumes there would be little change in real construction in March over the January & February average . . .
Whether weather…
oh, yeah, Ron, weather was definitely a factor, as it hit every February economic metric…how much, though, i couldn’t quantify..
@Rjs,
This past winter more global warming would have been nice, but we just got more climate change instead. I understand that the walruses, seals, and polar bears all feel differently about this. In central VA and all the mid-Atlantic region a strong La Nina usually brings a milder, drier winter, but not this time around. Thankfully though, I do not live in Texas.