This may be the most important housing chart of springtime 2021
This may be the most important housing chart of springtime 2021
My longform housing market analysis is almost complete, and will probably get posted later today or tomorrow at Seeking Alpha. I’ll post a link here once that is done.
In the meantime, consider the following. The Case Shiller national house price index had another sharp increase in February, and is now up 11.2% YoY, the highest rate since the days of the housing bubble in 2002 (green in the graph below):
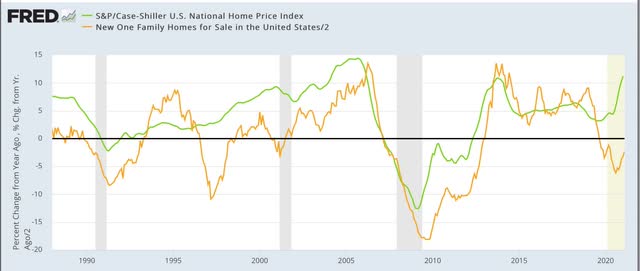 Meanwhile, look at inventory (gold). In absolute terms, the seasonally adjusted inventory of new homes for sale bottomed last August and October. Last August inventory was down -12.3% YoY. As of last month, it was only down -4.6% YoY. At this rate of change, it will be *up* YoY by about May.
Multiple offers over asking prices within days if not hours are now becoming common. We are experiencing the hottest “seller’s market” in housing since the bubble.
A sharp break in house prices and inventory levels is likely to be the biggest “surprise” in the housing market between now and Labor Day.
This. Already depressed that we decided a while back not to sell this year.
Otoh, as some people on this blog can tell you, those types of transaction are by no stretch of the imagination happening across all of the nation.
Ken:
Still a hot market. Not a lot of used homes of substantial size on the market.
On a two-values chart, why would anybody pick colors with such minimal contrast? Thank God they’re not traffic engineers involved in traffic light design.
@Eric,
Red/green colorblind people don’t get no respect.
Any boom that the US gets from the residential inventory shortage will be more than made up by the excess inventory in the commercial real estate market. A lot of commercial property is in a holding pattern still in pre-pandemic hands OR banks, but business operations will be permanently affected by the forced march to web based office and retail solutions brought on by the global pandemic. People will still want to eat dinner out though, so expect a lot of new starts in restaurants, but in existing premises that fell victim to Covid-19.
If one sells their home in a booming market then one is also faced with buying their next home in a booming market unless they plan to live with relatives until the market cools off. As great as it sounds to make a huge profit selling my home, then the prospect of living somewhere other than where I now live totally overwhelms that windfall opportunity.