– by New Deal democrat
Weekly initial and continuing jobless claims give us the most up-to-date snapshot of the continuing economic impacts of the coronavirus to the average worker. Twelve weeks after calamity first struck, the theme remains “less awful.”
First, here are initial jobless claims both seasonally adjusted (blue) and non- seasonally adjusted (red). The non-seasonally adjusted number is of added importance since seasonal adjustments should not have more than a trivial effect on the huge real numbers:
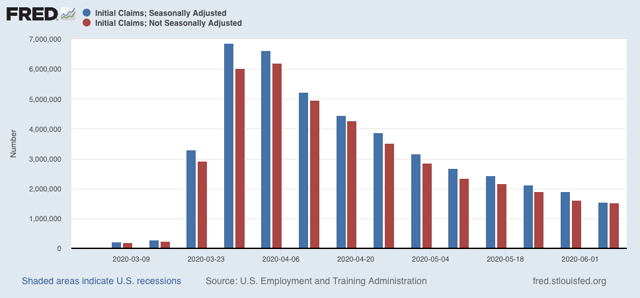
There were 1.542 million new claims , which after the seasonal adjustment became 1.537 million. This is a -355,000 decline from last week’s number, and the lowest so far since the virus struck – but still almost twice as bad as the worst week during the “Great Recession.”Since we are more than a month after some States “reopened,” these new claims primarily represent spreading second-order impacts.
Unfortunately, the “less bad” trend has not continued in continuing claims, which lag one week behind. In the past three weeks, both the non-seasonally adjusted number (red), and the less important seasonally adjusted number (blue) have remained nearly stationary. This week the former declined by 339,000 to 20.929 million, but was 88,000 above the 20.841 reading of two weeks ago; while the latter declined by 179,000 to 18.920 million, 58,000 above its 18.861 reading two weeks ago:
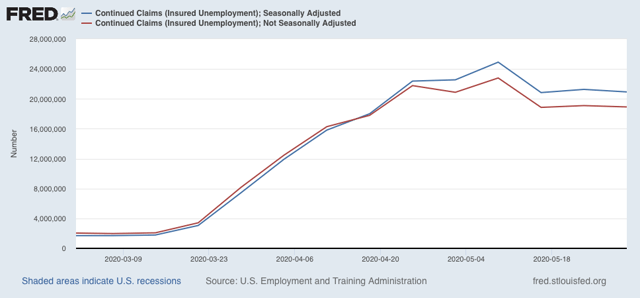
This tells us that the spreading new damage is about equal to the callbacks to work from various sectors “reopening.”
On a more long-term note, historically continuing claims have peaked at the end of or just after the end of recessions. Here’s the graph showing that from the beginning of the series through 2009:
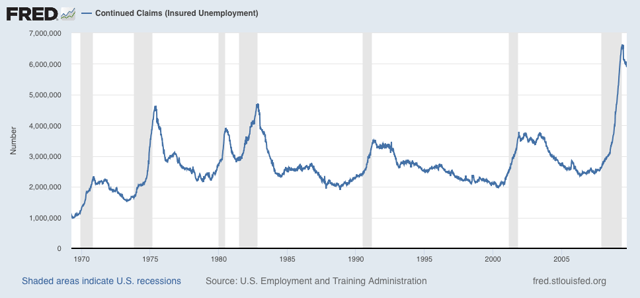
Depending on what happens with the King of Coincident Indicators, industrial production, when it is reported next week, it is possible that the NBER could call an end to a very short recession. But since the virus has not gone away, and indeed new cases are increasing again, I suspect we may see renewed restrictions implemented in many parts of the country in the next few months.
The Case For The Patterned Science of the Asset Debt Macroeconomic System
The 5 minute fractal mathematical pattern of the ’terminal’ (after 3 PM) Thursday-Friday 11-12 June 2020 DJIA ’Dead Cat Bounce.’
The Global Asset Debt System Macroeconomic is deterministic, is counterbalancing, and is self organizing and is defined as a pattern science by self-assembly of regular
fractal mathematic patterns of composite major asset class valuations. The Global assetDebt system is simply too enormous of a system for governments and central banks to have a substantial effect, although the effects of the 2008-2009 historically unprecedented global intervention can be qualitatively observed in the ‘bending’ of fractal groupings’ and the expected fractal nadir valuation point. In late 2008 the US undertook 13 trillion dollars of money printing, quantitative easing, zero treasury rates for 5 years and the assumption of CDO related toxic assets – all bipartisanly passed within three days by the US Congress and with likely an equal amount by the Eurozone, et. al. Without the intervention, the 2/5/5/3 monthly fractal grouping reveal that the March 2009 global composite equity valuation low would have occurred in September 2009.
From this September 2009 the ideal global composite equity low – unassisted by governmental and central bank massive intervention – final monthly fractal series
completing (to this point) a US 1807 36/90/89 year Fractal Series and the 9/20/12 year 1982 second fractal subseries of the 1932 89 Year US Third Fractal is 26/53/53 of 53 months. The third fractal subseries within the final third 53 month began in December 2018 is composed of a 3/7/7/5 of 5 month or 11/26/26/17 of 18 week fractal series.
The End Thursday – Friday 11-12 June 2020 DJIA 5 minute Fractal Math:
Starting after 3PM pm Thursday: for the DJIA …
base first fractal: 7/15/10 = 30 (5 minute units) : x/2-2.5x/1.4-1.6y (using second fractal/2.5 = 6 units as ideal base length)
The second fractal is composed of two fractal subseries 7/18/10(3) and (3)9(11)/17(17)
Starting after 3PM pm Thursday: for the DJIA …
base first fractal: 7/15/10 = 30 (5 minute units) : x/2-2.5x/1.4-1.6y (using second fractal/2.5 = 6 units as ideal base length)
second fractal composed of two subseries 7/18/10(3) and (3)9(11)/17(17)
The (5 minute units) fractal series is 30/57 units :: x/2x
There are 79 (5 minute) trading units in the trading days.
Over the next 320 (5 minute) trading units, expect an historical nonlinear devaluation of global equity and commodity and gold and bit coin value.