Coronavirus update for June 8: declining trend in new infections has stopped
Coronavirus update for June 8: declining trend in new infections has stopped
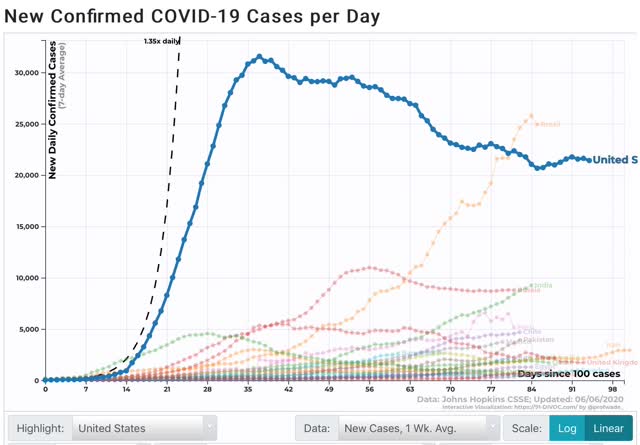
Well, there has been. New infections are not declining anymore. In the last week, the 7 day average has increased slightly, and there has been only a 1% decline of the 7 day average in the past 2 weeks:

On Saturday, the 7 day average was 21.4k new infections, higher than the 21.0 cases of 10 days ago. Two weeks ago there were 21.7k new infections.
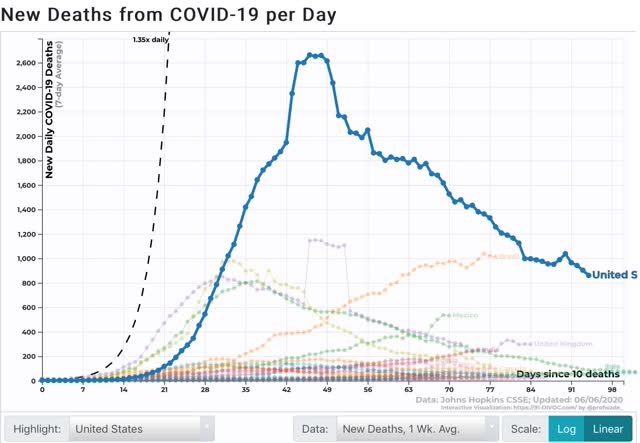
The 7 day moving average of deaths, which lags by 1 to 2 weeks, is still in decline, although I expect this to follow suit:

Because increased testing can be expected to find more cases, it might be argued that that is the cause of the recent reported increase in cases.To check that, below I am comparing the 7 day average change in testing vs. the 7 day average change in new infections for each Wednesday and Saturday. In general between late April and late May we had a decline in reported new cases, even with a dramatic increase in testing. In the last two weeks the increase in new testing has abated somewhat, which we might expect to show an even steeper decline in new infections if the trend were continuing. But instead the level of new infections has turned around and increased:
| Date | 1 week % Change Testing |
1 week % Change New infections |
|---|---|---|
| 4/18 | (-0.6) | (-5.2) |
| 4/22 | 20.6 | (-1.7) |
| 4/25 | 44.7 | 0.0 |
| 4/29 | 24.6 | (-2.0) |
| 5/2 | 9.4 | (-6.5) |
| 5/6 | 14.4 | (-5.3) |
| 5/9 | 15.9 | (-10.9) |
| 5/13 | 22.3 | (-14.4) |
| 5/16 | 25.0 | (-9.8) |
| 5/20 | 22.3 | 0.0 |
| 5/23 | 16.1 | (-2.2) |
| 5/27 | (-1.8) | (-8.7) |
| 5/30 | 0.7 | (-4.5) |
| 6/3 | 16.4 | 3.3 |
| 6/6 | 18.3 | 1.4 |
Thissuggests that the increase in new infections is signal and not noise, even if we can’t be sure that there’s been an “actual” increase vs. a leveling off.
The composition of States with the worst outbreaks has changed as well.
The Northeast Megalopolis from DC up through New Hampshire remained the hardest hit for deaths per capita:
| State | 1 week Deaths Per Million |
|||
|---|---|---|---|---|
| MA | 10.7 | |||
| RI | 8.2 | |||
| NJ | 7.6 | |||
| IL | 6.0 | |||
| CT | 5.7 | |||
| MD | 5.5 | |||
| NH | 4.7 | |||
| PA | 4.4 | |||
| DE | 4.3 | |||
| DC | 4.3 | |||
| MS | 4.2 | |||
| NY | 4.2 | |||
Note that Mississippi had risen to #11.
When it comes new infections, however, the three States of the NYC metro area plus Pennsylvania have dropped out, while Southern, Great Plains, and Western States have all joined the list:
| State | 1 week Infections Per million |
|||
|---|---|---|---|---|
| MA | 140.4 | |||
| MD | 129.2 | |||
| NE | 123.1 | |||
| AZ | 121.5 | |||
| DC | 111.7 | |||
| IA | 101.2 | |||
| UT | 100.9 | |||
| AR | 98.8 | |||
| VA | 96.8 | |||
| NC | 94.3 | |||
| IL | 89.9 | |||
| LA | 89.4 | |||
On a per capita basis, the MId-Atlantic from MD through NC is hard hit. But most noteworthy are the additions of NE, IA, AR, UT, and AZ.
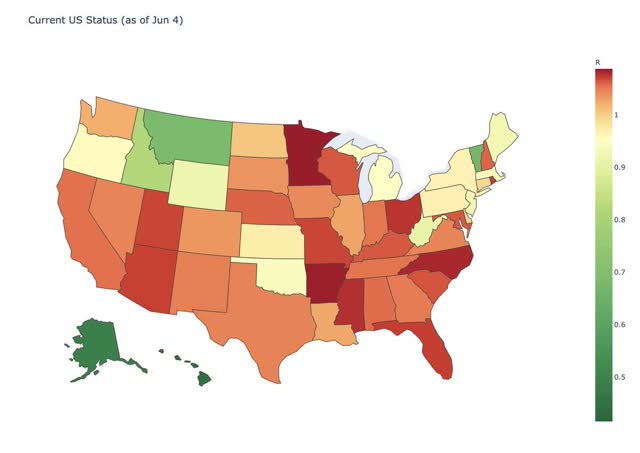
This is also shown in a graph of Reinfection status from several days ago (r less than 1 = good):

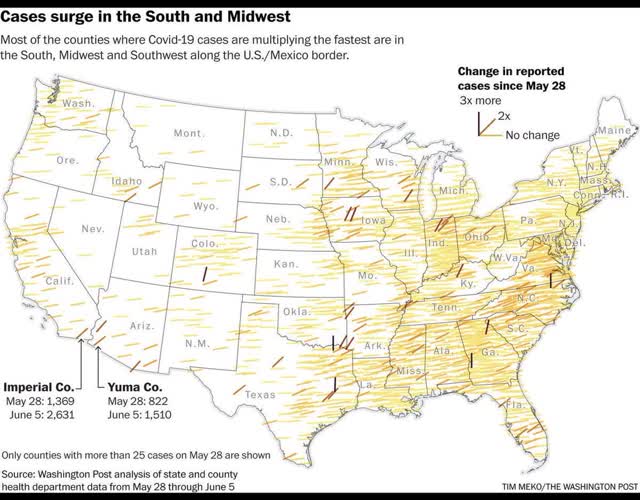
And this graph of the doubling rate of infections by county:

The interior South and some rural portions of the Midwest are now leading in outbreaks.
This, unfortunately, is in line with my forecast over the past month: that the population of the US as a whole lacks the political and social will to beat the coronavirus. As a result, the outbreak will continue to wax and wane as complacency alternates with fear generated by big new outbreaks. The massive protests we have seen over the past 10 days are only going to seed further outbreaks.

The “increased testing” data that looked so positive is in part because the CDC isn’t yet distinguishing between testing for the virus and testing to see if someone has the antibodies.
The latter is good to know, but rather useless in telling whether the infection is spreading. And, unfortunately, combining the two makes it significantly more difficult to tell if we are any closer to testing being as widespread as it needs to be, or if (as here in NJ), we are only just getting enough testing kits to test people who are not showing symptoms.
Ken:
There is a site which shows confirmed cases and deaths. I have been using these stats to determine where we are. Michigan was not quite 1 death in 10 confirmed cases and now it is about 1 in 11. It is hard to get a handle on where we are heading. The right to protest certainly is feeding the increases or at best the leveling off when we could have continued decreasing.
We stay home mostly. Just out for some skim milk or pickup carryout.
I am all in favor of social distancing, mask wearing, hand washing etc but I have to say the data is not really supporting this very well. Wisconsin—except for Milwaukee and Madison —basically opened up with no restrictions as a result of the Wisconsin Supreme Court ruling 4 weeks ago and much to the delight of the late night comics people flocked to taverns without regard of masks or social distancing. I certainly expected to see numbers bump up by now but in fact they have fallen steadily as has the percentage of positive tests. Yesterday nobody died in the state for the first time in 3 plus weeks. The state also had no appreciable uptick from in person voting in a late April primary. Now WHO is saying you are not likely to get the virus from asymptomatic carriers and there is a correlation between the sickest patients and vitamin D deficiency. You of course get vitamin D from dairy, supplements and sunshine. I am guessing there will be little if any uptick in serious cases as a result of the protests just as I have yet to see anyone tie outbreaks anywhere to the Spring Break revelers in Florida or the Memorial Weekend partiers at Lake of the Ozarks and the public health officials should probably tone down their warnings until they have more data to back them up. It is looking a lot more like this is a nursing home, mass transit, and meat packing plant disease with the close living of poorer people in extended families and health care workers being the other high risk circumstances. And I am all on board with minor inconvenience to slow the spread. It is a little bit like the boy who cried wolf. The more times the experts predict disaster without disasters occurring, the more likely they will be ignored when things do get bad. Watch the data, preach good easy things but do not predict.
I don’t agree Terry. The WHO’s point is frankly irrelevant. There are few truly asymptomatic people. It’s noise.
With I-95 opening back up, infections will rise, just the nature of the beast. Wisconsin basically isn’t tracking anymore.
Nursing home, mass transit, meat packing, factory work, and offices–especially those with tight floor plans, but not exclusively.
And medical conferences. (The legendary one in Boston produced Indiana’s first two confirmed cases, for instance.)
Oh, and churches. And likely other extended, indoor gatherings.
I’m seeing three new cases in Wisconsin yesterday, excluding Dane and Milwaukee Counties: one in Kenosha, one in Waukesha, and one in Washington. Also a pop in cases in those areas at the end of the month and beginning of this one, which would be expected after a ruling four weeks ago.
Wisconsin
Sun, June 7, 2020
2 died this day
650 total deaths
21,161 total confirmed cases
211 new confirmed
1.0% daily growth
http://www.cashin.ru/virus/usa/
That would be a great stat if Milwaukee and Madison were walled in. They are not and people travel.