What is the Real Prevalence of Coronavirus Across States?
Reposted from Brad DeLong’s Grasping Reality:
What is the Real Prevalence of Coronavirus Across States?
Click on the image to enlarge
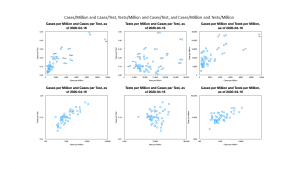
 Tests per million times cases per test gives you confirmed cases per million. But we want true cases per million.
Tests per million are different across states because (a) the states are undertaking testing with different levels of effort and (b) the prevalence of the virus is different in different states.
Confirmed cases per million are different across states because (c) states are testing at different rates and (b) the prevalence of the virus is different in different states.
Cases per test are different across states because (d) some states are not testing much and hence are still picking (relatively, for their state) low hanging fruit and (b) the prevalence of the virus is different in different states.
We have data on confirmed cases and tests across states. How do we use that to get real as opposed to fake estimates of where the virus is in the different states?
And then there is the lag: how do we do the nowcast, taking proper account of acceleration and deceleration in the progress of the disease?
Georgia, for example, is fifth in cases per test, at 0.24. Georgia is also fortysixth in tests per million, at 6598. And so Georgia is thirteenth in cases per million, at 1590.
If Georgia were testing at the same rate as New York—30000 per million—how many cases would it be reporting, and what would its confirmed caseload be? Its cases per test is presumably elevated because it is not testing very many people, so simply multiplying by 4.5 is not right. What is right?

“What is right?”
If you are Trump voter, attending a packed Sunday service tomorrow is right. MAGA
Apparently we don’t need testing. We need to resist governors who are stealing our freedom . . Freedom to get any virus we’d like and then infect others because we also must resist the authoritarians who demand we wear masks and gloves because our right to say f-you is more important than the lives of people I don’t know.