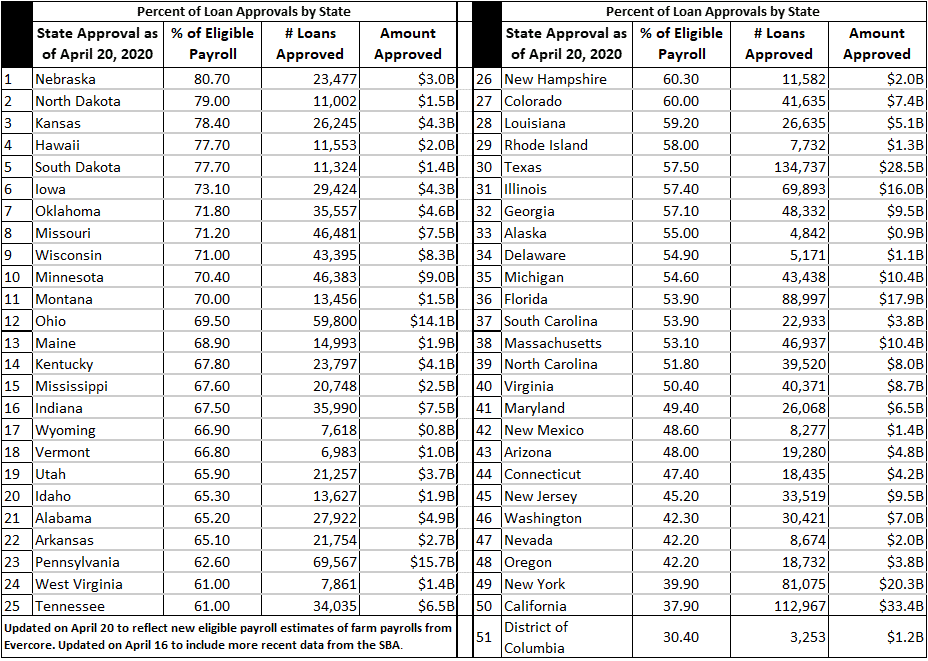
First Pass of Small Business Loans to States
This was the first pass (Ernie Tedeschi of Evercore prepared the data) and it is arranged by the percentage of loans completed in each state. As you can see Nebraska received ~81% of the loans applied for by the small businesses in Nebraska. One million, 35 thousand and 86 SBA PPP Loans (1,035, 086) were approved by April 13 totally $247, 543, 397, 521 by 4,664 lenders. Seventy percent of the funds were already allocated by April 13.
 Some Applicant Complaints:
- Applied at Bank 0f America on April 3. Got 3 calls on Friday Saturday and Tuesday asking if I uploaded my documents. They were already there!! Instead of approving my loan BOA is delaying and stalling to run out the clock.
- In Michigan, one small company dealing with Comerica was told repeatedly Comerica had not received the code to apply for the loans yet. The small ten person applied when the program first started.
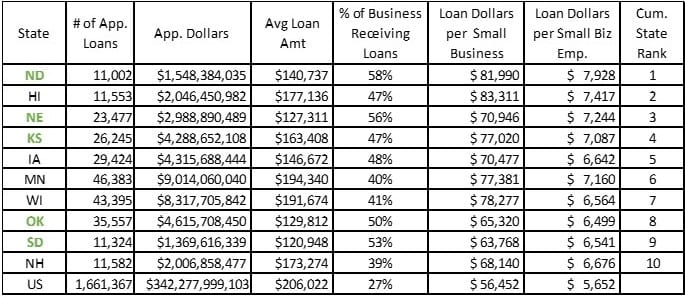
Some detail from Bob Clough at “CloughNotes” which looks at the numbers in a different manner after the leap.
The state-by-state data reveal significant disbursement ranges across three key metrics:
- First, the percentage of small businesses in a state actually which actually received a loan. Fifty-eight percent of North Dakota’s small businesses received support. Fifteen percent of those in California also applied and scored a national average of 27%. I (Bob) call this the Participation Rate.
- Second, how many dollars were awarded to each state relative to the number of small businesses in the state? This represents a “per capita” metric which accounts for the variety of small business distributions across states. The metric varied widely with Hawaii ranked the highest at $83k per business and Florida the lowest at ~ $40k. The national average was $56k.
- Third, how many dollars landed in each state relative to the number of employees in a state’s small business sector? This is another per capita metric and an important given the program’s intent to support PAYROLL checks across small businesses. This metric also displays a broad range, from Nevada’s low of $4k per employee to North Dakota’s high of nearly $8k against a national average of $5.6k.
Using the data from the three metrics, Bob Clough calculates a ranking for each metric which are depicted in a map of dark shaded winner and light shaded loser states.
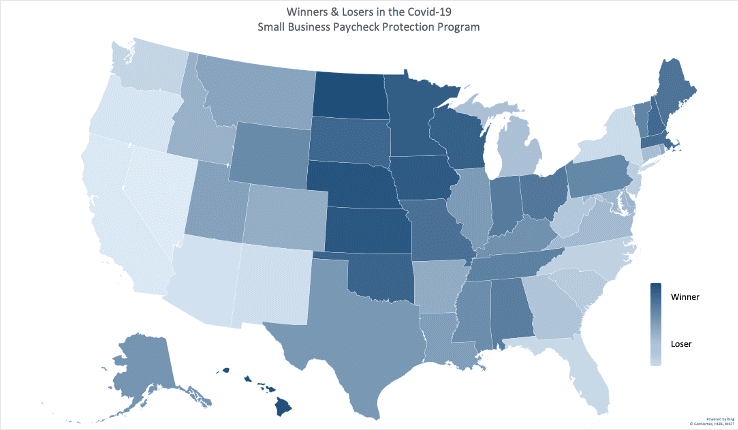 CloughNotes answers the question of where did the money go and was there a systemic bias favoring some states over the other states. Again dark shaded states benefited more so than the lighter shaded states. Politically based answers to this phenomena follow:
- Trump states (2016) received 15% more loan dollars per small business than Clinton states ($60k vs $52k per business) and received 8% more dollars per small business employee.
- Swing states received 5% more as measured in either dollars per small business or dollars per employee.
- Republican governors received 11% more per small business, and 9% more per small business employee than their Democratic colleagues.
Bob Clough does not come out and claim a political conspiracy or political motivation. He does suggest the “disbursement of federal dollars absolutely has political impact and the extent to which it favors certain geographies over others cannot be ignored.” Bob has his own chart up which differs from the earlier chart above as he used different criteria in which to assemble it. I did take a snapshop of the top 10 states which included states which stayed open (green), swing states (WI and MN), other Repub states (IA in addition to states which remained open, and NH and HI. A brief comparison to the other spreadsheet shows.
 Congress should review the impact of the first dispersal of funds and make the appropriate changes so as not to repeat the same funding patterns with an eye towards a lesser range of dispersal and a narrower per capita by employee distribution between states.
“Winners & Losers in the Small Business Paycheck Protection Program,” CloughNotes, Bob Clough, April 18, 2020
“Small-Business Rescue Shows Not All States Are Created Equal,” Bloomberg, Zachary Mider and Cedric Sam, April 20, 2020
What a shock. Isn’t stiffing blue states and rewarding red just how the system works? Or maybe it’s because blue states are so poorly managed that tRump’s “only the best” political appointees could see they don’t deserve any aid. Yeah, that’s it.
Kwark, maybe it is because the blue states have so much money left over that they can give it to the Feds to redistribute to the red states that the republicans/Moscow Mitch believe they are just balancing out the distribution. Thus the blue states don’t need the money. :}
We all know what that blue map means. Remember how the republicans responded initially after hurricane Sandy?