Coronavirus dashboard for April 9: Are new cases peaking? Or is a lack of testing failing to pick up continued spread
Coronavirus dashboard for April 9: Are new cases peaking? Or is a lack of testing failing to pick up continued spread
Here is the update through yesterday (April 8) (NOTE: significant new developments in italics)
I’ve changed the format, moving the “just the facts, ma’am” data to the top, and comments to the end.
The four most important metrics are starred (***) below.
- Number: up +32,509 to 432,438 (vs. 33,787 peak on April 4)
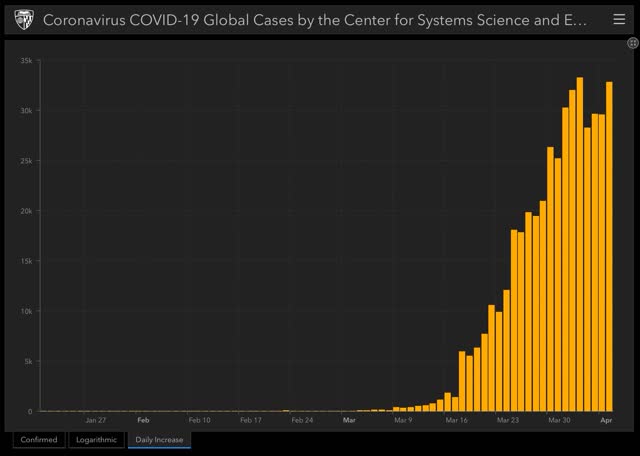
- ***Rate of increase: day/day: 8% (vs. 10% for the past week, and 9% on April 7)
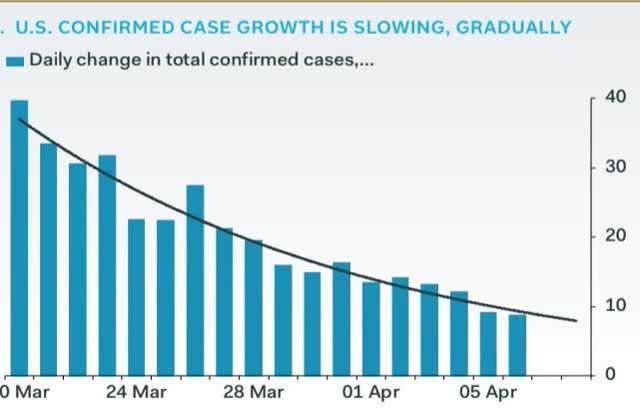
The exponential growth rate began to fall from 35% on March 24. It now looks like in the past 10 days or so it has been in a new, slowly decelerating trend, declining by between -0.5% and -1%/day. Here’s a good graph of that trend if a few days old:
State lockdowns appear to be working.
Ben Engebreth is tracking coronvirus infection and testing numbers for each State, with graphs, here. Also, there is an awesome interactive tool to measure infections and other data for various countries and US States at 91-divoc.com.
Number of deaths and infections and rate of increase of testing (from COVID Tracking Project)
- ***Number of deaths: Total 14,405, up +1,874 day/day
- Rate: increase of 15% day/day vs. average of 16% in past week
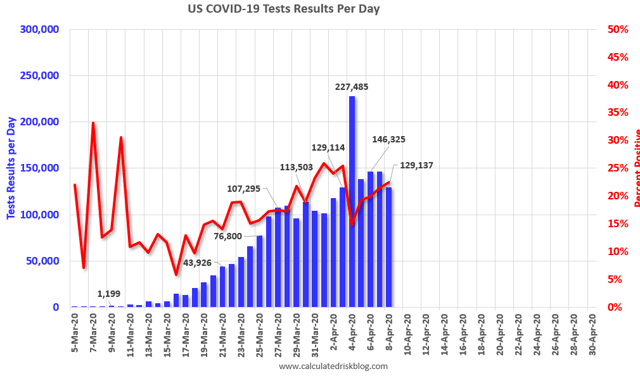
- Number of tests: 141,309 down -4,796 vs. 155,063 recent peak on April 6
- Rate: decrease -3% vs. number of tests previous day
- Tests pending result: 17,228 vs. 16,557 on April 7 day/day
Comparison of rates of increase in documented infections vs. testing
- Infections +8% vs. Tests -3% day/day
Result: The rate of testing appeared to be catching up a little bit to the spread of the virus, but has stalled again in the past week at about 140,000/day. It remains far below what is needed, which is probably now at least 250,000/day, and is falling further behind.
- Number: 141,309 new tests vs. 30,570 new diagnosed infections
- ***Ratio: 4.6:1
In South Korea, where aggressive testing has led to a near-total disappearance of new cases, the inflection point where the number of new daily cases plateaued was reached when the ratio of tests to new cases found reached 15:1. Any ratio less than that suggests that not enough testing is being done. Yesterday’s ratio of 4.6:1 is not only far behind, but has gotten worse in the past 4 days. I am very concerned that we face a situation similar to what we had a month ago, where insufficient testing was hiding the spread of the virus. That the percentage of positive results to total tests keeps rising only heightens that concern — i.e., we are not looking for new potential breakouts.
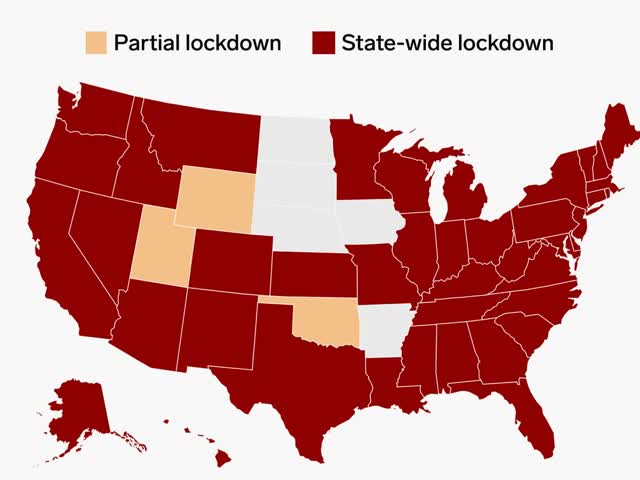
- ***Total lockdown: (SC joined yesterday) 43 States, 306.7 million, 92.4%
- ***Business lockdown: 2 States (KY, MA) 14.4 million, 4.3%
- Partial restrictions on business (bars, restaurants): 5 States (IA, ND^, NE, UT*^, WY^) 9.7 million, 2.9%
- School closure only: 2 States (AR^, SD*) 3.9 million, 1.2%
- No mandatory restrictions: NONE
*some local areas under lockdowns
^restrictions on or quarantine of travelers from out of State
There have been no meaningful changes in the past day.
US States with “test, trace, and quarantine” programs
- Under development: 6 States: CT, MA, MD, NJ, NY, UT
Summary for April 9
Here’s how we stand (meaningful new developments in italics):
- About 95% of the total US population is under total lockdown.
- Mandatory lockdowns, first implemented on Statewide bases 20 days ago, appear to be paying off, as the daily rate of increase in new cases is now in single digits. The peak in new daily infections might only be about 10 days away – and may possibly have already happened on April 4)
- BUT the number of daily tests appears to have stalled again at about 140-150,000, and is far short of of what is necessary. As a result, we may be missing an increasing number of actual new infections, meaning that the slowdown in diagnosed infections might be an artifact of the lack of testing, rather than a true result.
- The Trump Administration has still not mandated a nationwide lockdown.
- The Trump Administration has taken no meaningful steps to mandate mass production of necessary medical equipment.
- The Trump Administration has taken no steps towards a nationwide “test, trace, and quarantine” plan that will be needed to lift lockdowns, or to assist States to do so.
- To the contrary, the Trump Administration has announced an end to support of community testing.
- California’s governor has announced a plan for the States to coordinate in making purchases of the necessary equipment.
- Massachusetts has begun to develop its own “test, trace, and quarantine” plan. The governor of Connecticut announced two days ago that it, NY and NJ will also work on a regional plan. Utah and Maryland are also said to be developing their own plans.
- Until States or the federal government implement a regimen of “test, trace, and quarantine,” lockdowns cannot be lifted.
- Contrarily, North Dakota, a State with no lockdown, lifted part of its interstate travel restrictions yesterday.
An epidemiological point: The statement
“Are new cases peaking? Or is a lack of testing failing to pick up continued spread”
doesn’t make a lot sense. If you are defining cases as identified infections, then reduced testing means fewer cases. If you are defining cases as incident infections, then you have to be _very_ careful as there is a 5-10 day lag between infection and diagnosis. Thus even with an unchanging testing policy, a peak seen in the case data now would indicate a peak maybe ten days prior in incidence.
In general I pay much more attention to deaths even though there is an average 20-25 day lag time there.