100 years of industrial production
100 years of industrial production
This is a post that can literally be written only once in 100 years!
Because as of last Friday, it has been exactly 100 years since the first publication of industrial production by the Fed in January 1919. So this is a good time to take a sweeping historical look at production in the United States.
The first graph below is the entire 100 year history, on log scale so that equal percentage changes in each time period are calibrated equally:
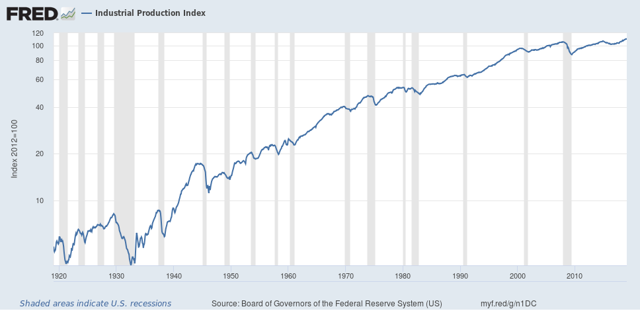
A few features stand out: the Great Depression, the World War 2 boom, and two downshifts in the long term trend: first in the 1970s-1999, and second from 1999 to the present.
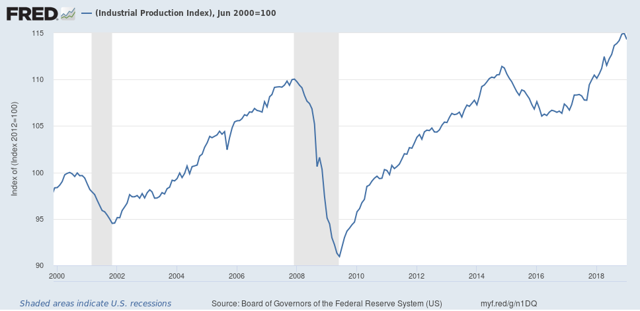
In fact, the past 20 years have been the slowest secular period since publication of industrial production started 100 years ago. As shown in the below graph, normed to 100 in June 1999, production has only grown 15% in the 20 years since. It grew just under 10% during the 2000s expansion, and only about 5% in the last 11 years:
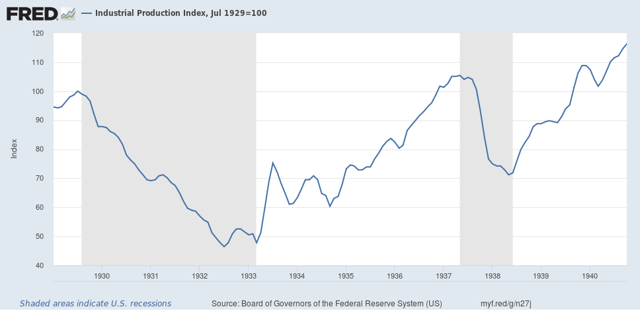
The worst previous period was the 1929-37 portion of the Great Depression, but even there production grew 6% by the end of that 8 year period, and exceed a 15% gain from 1929 by late 1940, 11 years later:
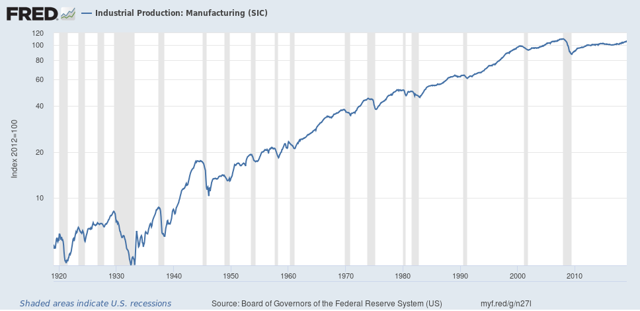
Note that growth has for all intents and purposes stopped since 1999.Again focusing just on the last 20 years, we see that manufacturing production grew just 11% during the 2000s expansion, and even now 11 years later, has still not equaled the 2007 peak:
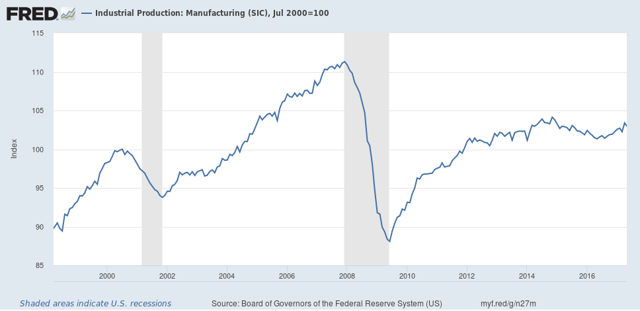
Total growth over the last 20 years in manufacturing has been just 3.4%.
Taking the long historical view shows the relative — and in the last decade, absolute — decline of the US as a manufacturing power. And it also puts paid to the notion that, at least in the last 20 years, the decline in manufacturing employment is mainly about productivity and mechanization. If it woeren’t for the rebirth of “Saudi America” in the energy sector over the last 10 years, industrial production growth in the US would have completely stopped.
Nicely done. U.S. has massively offshored manufacturing. China no longer wants its trash, alas, which used to be one of its prime exports to China.
Do we still see the U.S. as simply a consumer of goods and a producer of trash?
Doug:
Welcome back.
The Fed reweighs industrial output each year by nominal value. But this can produce some interesting results. Assume computer output grows 10% — much faster than total output — while computer prices fall 15%. So nominal computer output falls 5%. So in the second year computers will have a smaller weight in the index even though its real value rose sharply.
I understand why they use this methodology and see that it is the right way to do it. But does this methodology generate a downward bias to the index as the fastest growing industries decline in importance when you would expect the fastest growing industries to have a greater weight over time.
Does this bias explain some of the slower growth in industrial production in recent years?
So what does capitalism look like when we are a post manufacturing economy mostly bent on services?
From one standpoint, it makes us look weak that we cannot support ourselves. Another take is that the globalization will keep major world wars tamped down.
Interesting that China is focusing harvesting resources and labor from Africa. Give it another 30-50 years and we might not have any “developing” countries left to exploit for cheap manufacturing labor. Maybe we will be full mech by then? Kind of scary.
I’ve long given Massachusetts as an example of a post-manufacturing economy.
If that is correct the post-manufacturing prospects look great.
But it is great for the highly educated in the growth industries and manages to create service jobs at the low end. But it is not great for the middle and Mass suffers from a constant exodus of middle wage citizens.