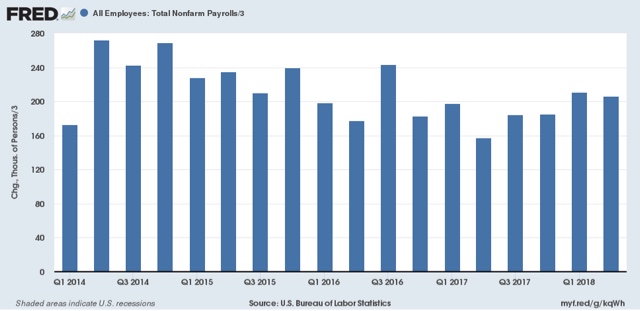
The pace of job creation declined from averaging over 200,000 a month between Q2 2014 through Q2 2015 to 180,000 or less during most of 2017. This year, it has picked up noticeably to over 200,000 per month again:
Why? A basic analysis of the business cycle supplies an answer. To quickly refresh, long leading indicators tell us about the direction of the economy more than 1 year out; short leading indicators by less than 1 year. Payrolls, along with industrial production, are the premiere coincident indicators.
So let’s see where we have been over the last few years.
Professor Geoffrey Moore identified four long leading indicators in his 1993 book on forecasting: corporate bond yields, housing permits, real M2, and corporate profits deflated by unit labor costs. These four historically were bundled into the proprietary “US Long Leading Index” by the Economic Cycle Research Institute, or ECRI. After disappearing from view since 2010, late last year an updated graph was published. Here it is:
Note that growth in the index nearly stalled in early 2016, before rising considerably later that year, then declining in early 2017.
In other words, the index forecast a stalling economy into early 2017, with growth picking up later in 2017 into early 2018.
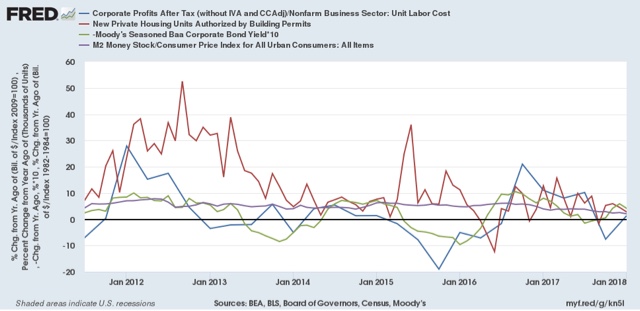
But we can graph the four long leading indicators ourselves. Here is their YoY% change over the last five years:
We can see their steep slowdown beginning in 2014 and continuing into early 2016, and an upturn in late 2016 through early 2017 before sharply decelerating again.
And here’s what happened with real GDP:
Note that YoY GDP growth started to decline one year after the LLI turned down, bottom six months after the trough in the LLI, and accelerated through 2017.
Thus, for example, in my forecast for 2017, which I published in January of the year, I called for the economy to be quite strong in the first half, and continued positivity in the second half. Following a normal pattern, strength in the long leading indicators should transmit into strength in short leading indicators as we get towards one year later.
So did we see an upturn in short leading indicators in 2017? We sure did.
Here, for example, are three of them: stock prices, real retail sales, and initial jobless claims (inverted), all normed to 100 in January 2016:
After largely stalling in 2016, they turned up somewhat in early 2017 before really taking off later in 2017 into early this year.
Here’s another short leading indicator: the ISM manufacturing new orders index:
Note how it turned up sharply going into 2017 and remained that way throughout the year.
So, to recapitulate, we had an upturn in the long leading indicators beginning in Q2 2016, which translated into an upturn in short leading indicators especially later in 2017, and now we see the strength spilling into the coincident indicator of job creation in the first part of 2018, as well as the other premier coincident indicator, industrial production:
I don’t mean to suggest that the reason for strong job growth this year is mono-causal. I suspect that hurricane and California fire repairs played an important role in new production and spending during the last few months of 2017. The turnaround in energy production has also helped. And the tax cut, while very inefficient — because it is so lopsided in favor of the wealthy — has shown up in decreased withholding tax receipts this year, which presumably means that amount of money is available to consumers to spend.
So, what’s ahead? Well, if you go back and look, the long leading indicators almost all hit zero at the end of last year, before a weak rebound in the first quarter of this year. The stock market has gone basically sideways for six months, initial claims for the last few, and manufacturing new orders, while positive, are not so strong as before.
Thus, back in January my forecast was for weaker, but positive, growth in the second half of this year compared with the first half.
For what it’s worth, consistent with my view, at the time ECRI’s LLI was publicly published late last year, ECRI’s Chairman, Lakshman Achuthan, indicated that they portended a global slowdown.
And that means I expect job growth to slow back down later this year.


Hi! Thanks for this. Can you help me understand the graph of the individual long leading indicators? You say they slowdown in 2014 through 2016, but I don’t see it. It is very clear in the index, of course. Thanks!
DB:
Welcome to Angry Bear. First comments always go to moderation to weed out spammers and advertising. I am sure New Deal Democrat will answer your question. He is pretty friendly and not an ogre like myself.