The Relative Price of Housing and Subsequent GDP growth in the USA
The great recession of 2008-9 followed an extraordinary house price bubble. The sluggish was characterized by a very slow recovery of residential investment. Oddly, the extensive revision of macroeconomic models which implied a very low probability of great recessions has not involved a focus on housing. Instead it has focused on financial frictions – essentially it is assumed that the 2008-9 recession was extraordinary because a major financial crisis occurred. Dean Baker dissents (as he often does) arguing that the severity of the recession could have been predicted given the massive decline in housing prices and earlier estimates of the effect of home equity on consumption. This note attempts to being to assess that claim. It also asks if it is possible to forecast GDP growth over the medium term. Finally it is part of the Rip Van Keynes series, because I will use an empirical strategy which has been out of fashion for at least four decades – basically an ad hoc OLS regression (sometimes I even include an exponential trend).
The basic result is that if the relative price of housing is high (compared to an exponential trend) then GDP growth over the following 5 years is low (compared to an exponential trend). Aiming to test out of sample forecasting, I start using 20th century data only.
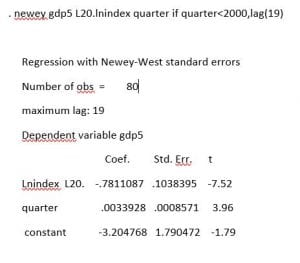
-7.52 is a fairly impressive t-statistic.
Lnindex L20 is the logarithm of the ratio of the all transactions house price index to the consumer price index lagged 20 quarters. Gdp5 is the growth of the logarithm of real gdp over the past 5 years. Quarter is the calender quarter up to the 4th quarter of 1999 = 1999.75. The data were downloaded from Fred and are described in what might be generously considered a sort of data appendix. One point must be mentioned here – the all transactions house price index is available only starting in 1975, so the first useful observation is growth of GDP from 1975q1 to 1980q1.
The series are quarterly, so the dependent variable is a moving average of changes summed over 20 quarters. In the crudest attempt to deal with this, I calculate Newey West standard errors with 19 lags. These would be valid if log GDP were a random walk with drift (the constant) and trend (growth slowdown).
This regression is at least a hint that 8 years before the great recession began, there was already evidence that extremely high relative price of housing was likely to be followed by low GDP growth. Because the regression is, at best, barely presentable, I focus on out of sample forecasting. pgdp5 is the fitted value which can be considered a very crude forecast of real gdp growth over the following 5 years.
Out of sample the forecasts and outcomes are positively correlated. The correlation of pgdp5 and gdp5 over 2000q1 through 2018q1 is over 0.86. Out of sample forecasts of GDP growth over the following 5 years seem to be quite useful. This may be simply due to the estimated trends.
The following regression shows that forecasts of deviations from trend are correlated with deviations from trend.
. newey gdp5 pgdp5 quarter if quarter>1999.9,lag(19)
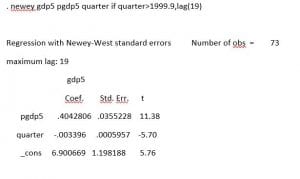
This is a test of out of sample forecasting performance. It is, to put it mildly, rather more successful than out of sample tests of long term macroeconomic forecasts usually are.
The data are, perhaps, more usefully summarized with a graph. Figure 1 (finally) is a scatter of the logarithm of the relative price of housing and GDP growth over the following 5 years.
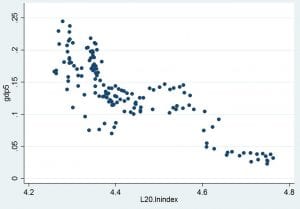
This ignores even the deterministic trends. Also the whole sample is graphed. Notably while some periods show extraordinarily high relative prices of housing and extraordinarily low subsequent real GDP growth, the GDP growth does not look anomalous. The computer is not surprised by the severity and duration of the great recession given the early 21st century housing bubble.
Here are the time series. L20.lnindexm4 is lnindex lagged 20 quarters – 4.0 (the base years for the all transactions housing price index and the CPI are different).
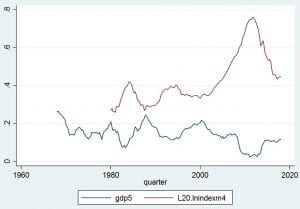
Notice that the first observation for the index lagged 20 quarters is 1980q1 because the index is available from 1975q1 on.
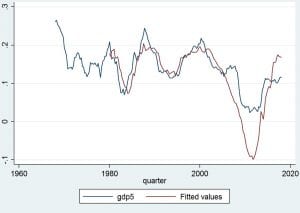
Here are the series of outcomes and forecasts. The only anomaly is that the great recession was so mild. The computer forecast 5 year gdp growth as low as -10% and it never actually was less than zero. Still this is unusually successful out of sample forecasting of medium term gdp growth.
Robustness checks etc after the jump. Also this post is available as a pdf here.
Robustness Checks
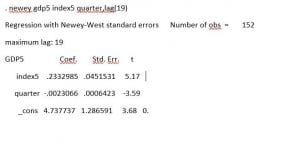
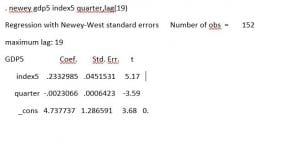
The deterministic trend in the regressions reported above is especially utterly out of fashion. If a time series is integrated (non stationary with a stationary first difference) then there will be spurious mean reversion of deviations from a deterministic trend. T-like statistics from regressions of one integrated series on another do not have a t-distribution. These concerns explain my strong focus on out of sample forecasting. A more standard approach to a nonstationary series is to difference it and hope the resulting series is stationary. So I consider the change in the ratio of the all transactions housing price index to the consumer price index over 5 years index5 = ln(indext /CPIt) – ln(indext-20/CPIt-20). This means that I lose 10 years of data, 5 for the growth of GDP and 5 for the growth of the relative price of housing and the first useful observation is GDP growth up until 1985q1. With a mere 60 quarters of data I get
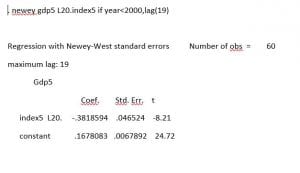
The out of sample correlation is lower being only 0.37. The scatter is much less impressive. Basically, the computer expected a major boom to follow the extreme decline in housing prices from 2006 to 2011.
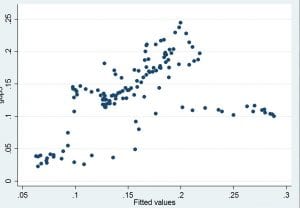
The decline in the relative price of housing from 2006 on was unprecedented and the simple regression is no more able to forecast the resulting recovery than any other method.
Another robustness check is to use a different series for housing prices. The standard series is the Case-Shiller index, but it is only available from 1987 on making estimates with 20th century data and 5 year lags pointless. Instead, I used an index even cruder than the all transactions house price index. The median price of new homes is available from 1963q1 on. This series can’t be interpreted as a price index as no correction is made for changes in the quality of houses. This makes it much more necessary to include a time trend and much less likely that detrending will really yield a stationary series. That said, the results are similar to those obtained with the all transactions house price index.
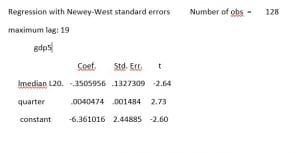
lmedian L20 is the log of the ratio of the median price of a new home to the consumer price index lagged 20 quarters.
The correlation out of sample in the 21st century of the predicted 5 year gdp growth and actual 5 year gdp growth is greater than 0.66.
Finally, I consider the growth over 5 years of the log of the ratio of the median new house price to the cpi
median5
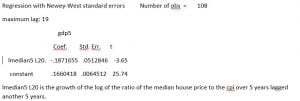
lmedian5 L20 is the growth of the log of the ratio of the median house price to the cpi over 5 years lagged another 5 years.
This gives the smallest coefficient and t-statistic, but the computer remains convinced that the variable is hugely important. Again the 21st century correlation of forecasts made using the 5 year difference and outcomes is lower than that of forecasts made with levels and a trend and outcomes. The correlation is just 0.3847 . This is still pretty good for medium term macroeconomic forecasts. Again the problem is that the dramatic decline in house prices from 2006 to 2011 causes the computer to forecast an boom.
Mechanism
It isn’t hard to make at least a plausible guess as to the path from high relative housing prices to low subsequent GDP growth. Housing prices appear to be mean reverting and declining house prices cause low demand through three well known paths. First residential investment depends on the relative price of houses, because the profits of builders depend on those prices. Second consumption is affected by wealth including home equity. Finally, home equity loans relax liquidity constraints.
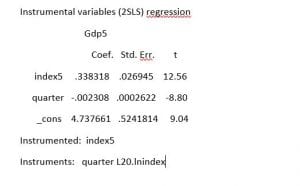
In fact, there is strong evidence that the relative price of housing is mean reverting and that a reduction is correlated with low contemporaneous GDP growth
In fact the OLS coefficient on lnindex L20 (the 5 year lagged log relative price) is roughly equal to the 2SLS coefficient, suggesting that other pathways might not be too important.
Conclusions
A high relative price of housing is correlated with low subsequent GDP growth over the following five years. This makes it possible to forecast 21st century 5 year growth rates using coefficients estimated with 20th century data. The data suggest the obvious path: mean reversion in housing prices and a negative effect of declining house prices on demand. The extremely simple regression suggests that a great recessin should have followed the extraordinary early 21st century housing bubble. In fact, the model dramatically over estimates the severity of the forecast recession.
Given the extreme ease of forecasting medium term GDP growth, it is odd that so much attention is devoted to models which give useful forecasts only a few quarters out. It is also odd that a huge literature focused on quite different mechanisms was developed after the great recession. But the oddest thing is that, in spite of the very clear evidence, macroeconomists often ignore residential investment and housing prices.
New Deal Dem
interesting and useful and probably important
but i had an odd though while reading… which may be obvious to all , or may be just wrong:
there are reasons for renting and reasons for buying that suggest that for some people there may be a good reason to pay more for one or the other. so a simple “financial” comparison may not quite tell the whole story.
one that occurs to me is that even if the “interest” on a house is more than “rent” on an equivalent place to live, the interest payment buys you the “right” to acquire equity, and to lock in the price you are paying. while rent only gives you the right to expect to have your rent raised every year and leave you after many years with nothing except the chance to compete in the rental market for a place you can afford that is tolerable enough to live in.
i have neglected here the financial cost of acquiring a down payment, but the point i think i am making is that simple cost comparisons may leave out the “important” considerations and lead us into what i might call the economists fallacy: reducing everything to money, and worse: money now.