Healthcare Costs – I Got Confused by Some Graphs
I don’t follow healthcare as much as others at this blog. I started playing around with some graphs at FRED and got a bit confused. I don’t mind being confused, but I like to clear up that confusion eventually. So perhaps someone can tell me what’s going on.
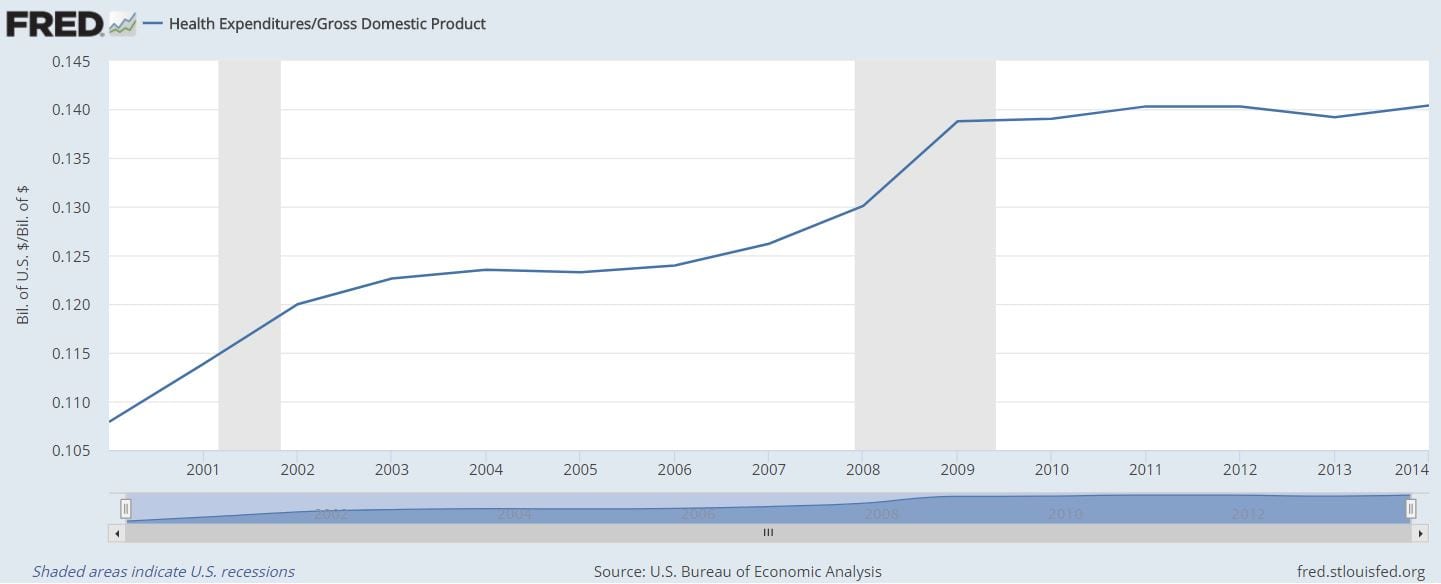
First, this graph of healthcare expenditures / GDP which seems to indicate that Obamacare bent the cost curve:
(click to embiggenize)
But looking at the annual change in healthcare expenditures / GDP, things become less clear:

(click to embiggenify)
Here, it looks like the rate of increase in costs declined through the early oughts, went up as the economy tanked (i.e., healthcare costs continued rising but GDP fell), and then stayed more or less constant (through 2014,the last year with this series). This graph doesn’t say Obamacare didn’t help, but it doesn’t scream that it does either.
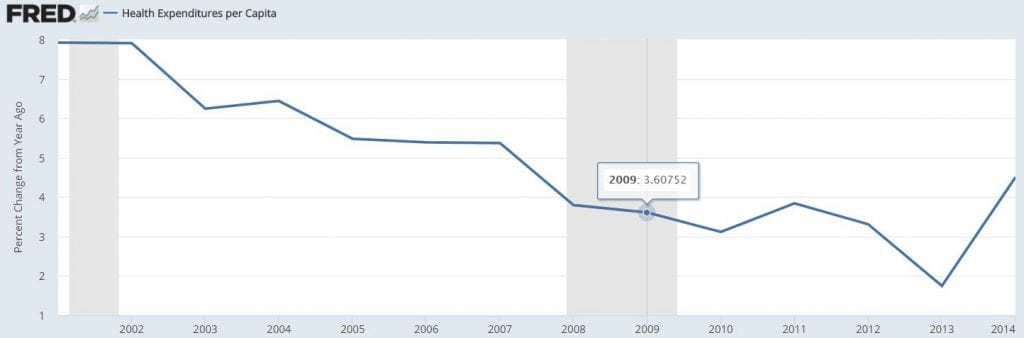
But this next graph is a real problem. It shows healthcare expenditures per capita:
(click to embiggenificate)
The rate of at which healthcare costs per capita have been increasing have been declining since 2001… well before PPACA took effect. Additionally, it kind of looks like healthcare costs per capita stopped declining after the passage of PPACA. Worse, the rate of increase of healthcare costs per capita may have begun picking up since then. That would imply that if there was any bending of the curve, it was the wrong way.
What am I missing?
“What am I missing?”
An analytic brain perhaps?
If you’re an educated economist as you claim, then you aren’t missing anything at all but only attempting to act as if you do. You’re a terrible actor.
Well, my costs for skiing have dropped incredibly since I stopped skiing after my back surgery.
Do the math,
EMichael,
As I understand it, what is supposed to make the PPACA work is that the insurance mandate brings in a large number of young and healthy individuals driving down the average cost of providing health services. But graph 3 suggests that in the 00s the rate of increase in the cost per person were already dropping, and dropping as the younger and healthier people were opting not to have insurance.
By the logic of the PPACA as I understand it, the declining rate of increase in costs was the effect we were supposed to see after PPACA, not in the decade leading up to PPACA. And we sure as heck weren’t supposed to see that second derivative go positive after PPACA.
So again… what is going on? Because PPACA cannot have started working in 2001
I am also bothered by the fact that the data cuts off after 2014. (The underlying data on health costs FRED uses for these series comes from the BEA. I have a vague recollection – may be wrong – that looking at health care costs became a bit of thing for the BEA during the early part of the Obama admin. Even if its being deliberately ignored by the new administration, there is no reason that data for 2015 is not available yet.)
i’d suggest that you should look at a graph of real health care as a percentage of GDP, per capita, et al….you dont want to be fooled by fluctuations in prices..
The Rising Cost of Health Care by Year and Its Causes
All the CMS detail you want if you follow the links.
1. “The nation’s reliance on corporate private health insurance left many people without a primary care physician. By 2009, half of the people (46.3 percent) who used a hospital said they went because they had no other place to go for health care. The Emergency Medical Treatment and Active Labor Act required hospitals to treat anyone who showed up in the emergency room. These uninsured patients cost hospitals a staggering $10 billion a year. The hospitals passed this cost along to Medicaid. ” I wrote about Pharma cost increases with Diabetes contributing a large percentage of the increase.
Hope that helps. The timing fits.
2. “The second cause of rising health care costs is an epidemic of preventable health crises. The four leading causes of death are heart disease, cancer, chronic obstructive pulmonary disorder, and stroke. Chronic diseases cause all of them. It means they can either be prevented or would cost less to treat if caught in time. Risk factors for heart disease and strokes are poor nutrition and obesity. Smoking is a risk factor for lung cancer (the most common type) and COPD. Obesity is also a risk factor for the other common forms of cancer.
These diseases cost an extra $7,900 each. That’s five times more than a healthy person. The average cost of treating diabetes, for example, is $26,971 per family.”
oboy
if people do not have insurance they are reluctant to receive medical care. when they do not receive medical care, costs per capita go down. Likewise, when people have insurance, but that insurance is of the type common before the ACA, they are reluctant to receive medical care, therefore costs per capita go down.
If the rate of cost increases per person was going down before PPACA and then stopped or reversed after PPACA, it is because the young and healthy pool was less, not more healthy than the population that was insured before PPACA. But that was the premise that was supposed to make the whole thing viable.
Read the article. This has been going on for years now. Up till recently, the uninsured rate dropped to single digits which would have incorporated younger people. As I wrote, there are no controls on Pharma. Go back and read it. I am not going to do healthcare 101 here because you want to dispute it, the ACA, and the politics impacting it.
make that “real health care as a percentage of real GDP”, etc
again, you dont want your results skewed by inflation/deflation of health care or GDP..
“I don’t follow healthcare as much as others at this blog.”
You should have stopped there. Once again, if people do not get healthcare then costs per capita will go down.
Of course healthcare spending went up in 2014. That was the first year of Obamacare and 14 million more people had health insurance for the first time. What’s difficult to understand?
But the FRED data stops in 2014. The CBO has data that goes through 2017 and shows that 2014 was a one time bump as previously uninsured people got long deferred health problems handled. After 2014 there is again a decline in healthcare growth as the ACA cost reduction incentives kicked in. Incentives, by the way, that the Trump administration is repealing by executive order.
Bill:
Start here: Healthcare Costs and Its Drivers Today ; read this: The Causes of Rising Healthcare Costs; go here: Why the US Spends So Much More Than Other Nations on Health Care
The CMS data goes through 2016. Healthcare Costs and Its Drivers discusses what has been occurring. Uwe Reinhardt points to what is driving costs in the US and it is pretty simple. This is all detail and not just a graph. CMS has tons of detail in their links.
“What am I missing?”
America is aging. If you want per capita data to be comparable, you may need to adjust for that.
“If the rate of cost increases per person was going down before PPACA and then stopped or reversed after PPACA, it is because the young and healthy pool was less, not more healthy than the population that was insured before PPACA.”
That’s a pretty big leap.
I can’t believe anybody would indulge an economist who purports to be “confused” by looking at 3 top level FRED charts and then not going any further into underlying cause research to resolve his “confusion”.
Why do people fall for this pure “I’m confused” “con-job?
Run,
I read the article. The smoking gun it offers is that Medicare costs didn’t rise after being projected to rise 29% from 2010 to 2014. There are also some projections going forward.
But Medicare costs are just a piece of healthcare costs. And the data shown in the table at the bottom of the article seem, at a cursory glance, to make the point as my graphs. The article’s data also shows a big spike in costs in 2014 and 2015 (it has one more year of data than FRED) as a pct of GDP.
Otherwise, there is mention of chronic diseases, etc., and this nakedly unsupported statement:
I’d be more comfortable believing it if the author had gone through the effort of actually writing something that backed up that statement.
EMichael,
The argument was that before PPACA the uninsured were getting healthcare, but they were getting it at emergency rooms. The article Run links to says that was 46.3 percent of people using hospitals in 2010. PPACA was supposed to end the reliance on emergency rooms which was going to be one of the factors reducing costs.
BillB,
Link to CBI data? I note it is s but early to have actual spending data for 2017.
Arne,
Why is it a leap? Median age didn’t jump that much. I admit I am not an expert but I don’t see anything else that would have caused the change in trajectory which coincidentally happened around PPACA-time.
I am honestly trying to understand this for something I am trying to do in one of my other lives. My expectation based on what I read was that the rate of change in costs had itself changed for the better. Granted, as noted upthread, this isn’t adjusted for inflation, but inflation has been pretty low in this time period.
No, you did not read it or look at the links either detailing more data driving costs.
merde
Run,
I read it, looked at the data it included, followed some of the links, and even quoted the article above. As I said, the article’s smoking gun is a Medicare cost projection. To a lesser extent it relies on some preventable health problems driving up costs. But why would heart disease, etc., only bend the trajectory of the health cost / pop curve the wrong way when PPACA kicked in? It isn’t as if those problems just started in the last few years. I am leery of this kind of coincidences.
Mike:
I can assure you Medicare did not cost $3.2 trillion in 2015 as shown in the “The Rising Cost of Health Care by Year and Its Causes” and if you went to the CMS links you would also see the costs of healthcare for 2016 plus a breakdown of where all those costs went.
it just keeps getting worse.
Maybe it is me, but I doubt many emergency rooms did anything other than emergency services to people suffering from heart disease, and then threw them out on the street.
With more people being insured, more people were actually treated for heart disease on an ongoing basis.
Amazingly enough, this seems to follow the indisputable fact that if people receive more healthcare, healthcare costs go up. Just like when I stopped skiing, my skiing costs went down.
Ok, back to this abysmally deficient thread.
Mike, dont dismiss the possibility that not accounting for changes in price might be the reason for your the confusion in your graphs…the GDP price index had a few negative quarters during 2009 before returning to a +2% range, whereas prices for healh care services were growing at a 4 to 7% pace before 2009 and at a 1 to 2% pace thereafter..
Is per capita appropriate?
One of the goals of PPACA was to provide health insurance to more people. I know several people who would be dead now except that PPACA gave them access to health care. More people being treated could be showing up as rising cost per capita. PPACA may have been extremely productive in terms of producing quality and quantity of life, but that doesn’t show up in the GDP.
Kaleberg,
Of course you are correct.
“A child of five would understand this. Send someone to fetch a child of five.”
Groucho Marx
Here EM:
Here is a blow by blow cost of Healthcare from 1960 to 2015. 1960 = $27.2 billion and in 2015 it is $3.205 trillion for healthcare in the US. https://www.thebalance.com/causes-of-rising-healthcare-costs-4064878 The article talks about the ACA initially and then Medicare. Below Medicare in the Nations healthcare costs. If you wish to se the breakdown of what goes into the $3.2 trillion, go to the link below.
If you go here: The National Health Expenditure Accounts (NHEA) and click on the links you will get the 2016 numbers and also a breakdown on an Excel Spreadsheet.
This was in the Highlights. You can go down the list on this page and pull up different breakouts of what spending went towards nationally.
2016 US Healthcare Spending: “U.S. health care spending increased 4.3 percent to reach $3.3 trillion, or $10,348 per person in 2016. Health care spending growth decelerated in 2016 after the initial impacts of ACA coverage expansions and strong retail prescription drug spending growth in 2014 and 2015. The overall share of gross domestic product (GDP) related to health care spending was 17.9 percent in 2016, up from 17.7 percent in 2015.”
Mike got stuck on the Medicare part of the article and did not look at the rest of the chart.
Kaleberg,
I would agree with you myself. But one of selling points, straight from the horse’s mouth in 2008 (in this particular accepting the Democratic Nomination for President) was this: “If you have health care, my plan will lower your premiums.”
It would not be impossible to lower premiums for everyone with insurance while adding new insurers but it would be hard to do. So lowering cost per capita is more or less what Obama himself promised his plan would do.
Actually, if an economist was to do just a tiny, tiny bit of analysis, they would find, for the period shown (2001 – 2014) three clearly distinct periods in terms of Real Expenditures/Capita (adjusted for Inflation to 2014 dollars based on CPI-U), that the RE’AL lrate of increases were: :
2001 – 2004: $283 / person / year
2004 – 2009: $131 / person / year (-53%)
2010 – 2014: $ 90 / person / year (-31%)
And since the ADA didn’t even fully kick in until after 2014, the period for which FRED shows the data doesn’t include the period from 2015 & 2016, which is no excuse since with one google search the curious economist could find the Expenditures for those years published by the gov’t, including break-downs in where the expenditures went.
And then considering that the ADA insured far more people than before the Act one would expect, all other things having remained equal, for the per capita Expenditures to increase some.. unless Hospitals and Insurers reduced their prices in return for having more patients.
But doing the little bit of analysis the curious economist would have found per Capita Health Care Expenditures were dropping from 2004 and even dropping more from 2010 to 2014… which is the period AFTER the ADA bill passed but before the full benefits and sign-ups had occurred.
But then Mr. Kimel the economist wasn’t really at al interested in satisfying his curiosity.
Run why are feeding this propagandist who is a fully qualified economist with 1st grade addition texts? He’s not trying understand anything about health care costs or causes… he’s calling facts into question because he doesn’t like the facts.. he want’s a new narrative that suits his pre-disposed half-assed ideas.. whatever those are. He doesn’t even go into looking beyond the top-line FRED data which ends in 2014.
LT:
I want you to know the issues too. For example, if you read Politifact you will know that statement was erroneous actually made by Obama; however, anyone who gained a subsidy or insurance for the first time because they could not afford it did realize a substantial savings with the ACA which they did not have before the ACA. People with healthcare insurance probably did have a savings if you include the 10 essential benefits which did not exist in many cases for holders of insurance. How many millions of people gained insurance because of the ACA?
The data in the article The Rising Cost of Health Care by Year and Its Causes is the total cost of healthcare in the US and not just Medicare. If you co to the bottom of the article you will see CMS links which you will find excel spreadsheets breaking down the 2015 and the 2016 total cost of healthcare in the US including out-of-pocket costs. I keep pushing this with Mike because he is purposely ignoring my remarks, does not understand it, or is out right lying. Look for yourself. The Rising Cost of Health Care by Year and Its Causes and the spreadsheets are here: The National Health Expenditure Accounts (NHEA).
The 46.3% going to the ER is also cited in the article. The ACA took effect in 2010 and was not fully implemented till 2015. Even now parts of it have been delayed by Congress and blocked by the DA in the Oval Office or Congress. So how is the 46.3% stated? Here:
” So lowering cost per capita is more or less what Obama himself promised his plan would do”
holy sh!t.
What a worthless column. I am done dealing with trash like this.
So I went to CMS.gov and found this data set: https://www.cms.gov/Research-Statistics-Data-and-Systems/Statistics-Trends-and-Reports/NationalHealthExpendData/Downloads/NHEGDP16.zip
I don’t have the time to adjust for inflation right at the moment, but looking at the data as a percent of GDP… it seems that from 2010 to 2013, healthcare / gdp declined slightly from 17.4 to 17.2… but since then its been rising again… and in 2016 healthcare costs were at 17.9% of GDP.
If this is a success at keeping down costs, it is a reminiscent of the Republicans touting success for tax cuts… which tend to have a small positive impact on the economy in the first couple of years, and then a deleterious effect (that is bigger than the early positive effect) later.
Mike:
You come out here and make some type of statement. You made comments which were erroneous. And now you do not have time. Don’t bother analyzing it as the ACA was NEVER given the power to regualte the cost of healthcare or pharamaceutical and neither was Part D or Medicare on pharma as Congress blocked them. Brookings and others have showned where it has slowed the rising cost of healthcare. What has been lacking since day one of the ACA, any plan I have have read on single ayer, universal healthcare, Medicare for all is the power to regulate the costs of healthcare.
This is BS Mike and you have it all wrong.
Run,
This statement of your is where I have a problem:
As in my third graph, the rising cost of healthcare (national spend per person) was slowing as early as 2001. Had the 2001 to 2010 trend simply continued by now healthcare costs per person would actually be falling. The amount we spend per person would be less in 2016 than in 2014, say. But that isn’t happening, Brookings notwithstanding. That’s what I am trying to figure out.
This goes for this column and every comment by Kimel in it, especially the last one:
Mr. Kimel:
“what you’ve just said is one of the most insanely idiotic things I have ever heard. At no point in your rambling, incoherent response were you even close to anything that could be considered a rational thought. Everyone in this room is now dumber for having listened to it. I award you no points, and may God have mercy on your soul. “
Mr. Kimel states in his Jan 3, 9:46 am comment:
Statement #1:
“As in my third graph, the rising cost of healthcare (national spend per person) was slowing as early as 2001.”
Translation for clarity:
Health care costs were rising in 2001, but not raising as fast as before then.
Statement #2 (Part 1):
“Had the 2001 to 2010 trend simply continued …”
Translation for Clarity:
The 2001 to 2010 trend is a reduction in the rate of rising health care costs… not decreasing health care costs. Continuing the trend means
rising health care costs will rise by less going forward.
Statement #2 (Part 2):
” …. by now healthcare costs per person would….”
Translation for clarity:
After some period of years since 2010 with the increases in the heath care costs continuing to decrease at a constant rate (x% per year) they would….
Statement #2 (Part 3):
“…[health care cost would] actually be falling.”
Translation for Clarity:
Cost of health care would be falling say by 10% per year from $100/person per year at Year xo
$90/person per year at Year x+1 to
$81/person per year, at Year x+2 to
$72.90/person per year, at Year x+3 to
… etc
$0.002951/person per year at Year x + 100 .
It can never get to $0 (only approach it) and thus never go negative unless the trend is a negative 2nd or more than 2nd order polynomial..
Statement #3:
“The amount we spend per person would be less in 2016 than in 2014, say.”
Translation for clarity:
The Health Care costs per person would be less in 2016 than 2014 if the trend from 2001 to 2010 (see statement #2 -Part 1) had continued through 2014 and then if that same trend had continue to 2016..
Summary:
Mr. Kimel’;s statements #1, $2, & $3 in his Jan 3, 9:46 am comment are do not refer to his measurement of health care costs… are they $ per capita, or $ per GDP, or absolute dollars? He stated that he doesn’t have time to translate the values (whatever values he’s referring to still not known) to real terms (net of CPI-U inflation). or he doesn’t know quite how to do it yet, or he doesn’t think real costs are relevant or he doesn’t think they will make any difference The problem is that the rate of change in reducing costs depends on both the real cost reduction and the rate of inflation over time so you have to define what rate of change you’re referring to. When he refers to costs/GDP is he referring to nominal costs and nominal GDP or real costs relative to real GDP?
He also hasn’t yet stated explicitly what he believes the purpose of the ADA bill was. Does he believe it was to reduce health care costs per capita in real terms or be a lower proportion of GDP in real terms or what? Does he have an explicitly defined time by when his believe should be marked to market and what is the foundation for his belief?
In his initial post the data he used stops at 2014.. which was the first year of implementation. Does he believe that the ADA should have or was promised to reduce costs per capita or was it costs/ GDP or was in real costs of either of these metrics or nominal costs in the first full year of ADA implementation? Does he consider several states chose not to participate at all or that some decided to participate but hadn’t yet set up their State systems or decided not to use the Federal system?
None of Mr. Kimel’s beliefs nor their basis for them are stated explicitly in his original post. and trying to infer them from his comments after that is impossible… I tried…. they seem to vary in fact.
In composite Mr. Kimel is far from any standard analytic economics professional in his statements (though he purports to be an economics professional and I have no reason to think otherwise but that he doesn’t express himself or present his case or data as if he were an economics professional). Maybe he’s trying to appeal to the common layman so he therefore doesn’t convey his information any better than a layman with no expertise or capability to even understand the ACA’s dependencies.
Whatever Mr. Kimel’s problem he hasn’t yet even made a serious effort to convey it other than with 3 top-level FRED charts — 2 of which relate costs to GDP and one relates it to per Capita— in which he seems to be confusing rates of change of apples with oranges with absolute values of apples and oranges… or something… which I still can’t figure out
Another way of saying all this is that a well educated person, especially an economist, shouldn’t have this much trouble explaining himself to several other well educated people on this topic so there’s a definite disconnect between Mr. Kimel and his audience.
But this assumes his real intent is to “understand” and based on all evidence I reject that assumption (from day one in fact). The alternative thus is an intent to confuse and conflate the entire health care issues with some other objective Mr. Kimel has.
Anyway I find it immensely entertaining… like reading some of Trump’ twitters.
Run, thanks for the rundown on what you have cited and linked. I’m familiar with most of these though not in as much detail in each one. The health care issues aren’t new to me… I lived in Germany, my daughter even recievied EU benefits at not costs throughout the EU with a single number health ID issued to her at her first visit to a clinic in England.
I know the issues, and the problems for the most part, many in detail, and far better than most… you are of course an acknowledged expert and I don’t mean to Imply I am at your level by any means.. I don’t dispute anything you have stated or cited either explicitly or implicitly.
But I still don’t understand your reluctance to call out Mike for a lying propagandist while he says he’s just trying to “understand”. That was eminently obvious and evident from his post.. never-mind his comments after that. So I asked you why you indulge liars and propagandists? I’m not on your case per-se….but knowing your intelligence and expertise in the subject, it does beg the question of why you bother trying to teach a degreed economist the elements of 1st grade addition.. That is my interest. If you don’t like somebody questioning your motives all I can say is tough shit. don’t answer then.. its pretty simple.
Update here.