Changes in Healthcare Costs
I had a post the other day trying to make sense of changes in healthcare costs. Based on some of the comments to that post, a bit more thought, some data from the Centers for Medicare and Medicaid Services, and the CPI-All Urban Consumers, I think my point distills down to this graph:
(click to embiggen)
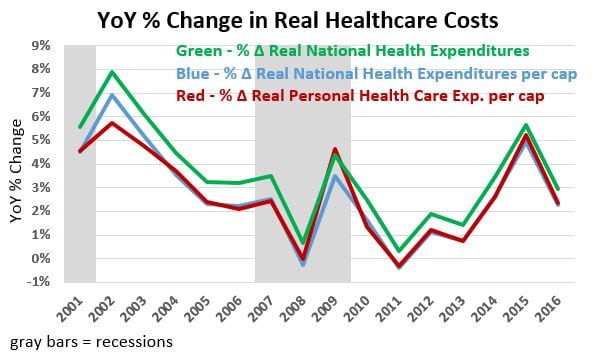
The graph shows the annual YoY change in real healthcare costs defined three three ways. The green line shows the annual change in total healthcare expenditures (adjusted for inflation). The blue line shows the annual change in healthcare expenditures (adjusted for inflation) per capita. The red line is the same as the blue line, but looks at the annual change in personal healthcare expenditures (adjusted for inflation) per capita.
Anyway, what the graph shows is that the rate at which inflation adjusted healthcare costs (I provided three flavors to show they all behave more or less the same) increased fell reasonably consistently from 2002 to 2008. I.e., costs continued to increase until 2007, but at a decreasing rate. And in 2008, real healthcare costs were actually lower than in 2007!! There was a spike in 2009, and then prices started coming down again… until 2011. After that, they rose until to 2015 and dropped again in 2016. Is 2016 a blip, a fluke, or the start of a new trend? Time will tell. This isn’t a topic I know enough about to make a prediction. That said, right at this moment, the graph doesn’t look to me like what I’d expect to see if 2010 marked the passage of a law that bent the cost curve. Or rather, not like a law that bent the cost curve in the right direction.
If you want my data, drop me a line at my first name (mike) period my last name (only one m people!!!) at gmail period com. I’m sticking a time limit of one month from this post going up on the request. Beyond that point, you might get lucky but I don’t guarantee anything.
Update… 7:40 PM PST Jan 3, 2017. Due to some of the comments on the earlier post, I added the paragraph that begins “The graph shows the annual…” plus other minor edits for clarity.
Someone has to stop this.
If I give continued medical treatment(not just emergencies in the ER) to an additional $20 million people, my healthcare costs will go up.
Somehow, this cretin cannot figure that out.
And now has two abysmal posts on this blog in a matter of days.
Someone has to stop it.
Though to his credit, there has not yet been a racist aspect of this thread.
But i can feel it coming.
EMichael,
As I noted before, it was stated before the passage of the law that the uninsured were getting healthcare. They were just getting it at emergency rooms which is a wildly expensive way to get such services. This was pointed out twice in the last thread, once by Run. So one of the benefits of PPACA was that it was going to reduce costs by eliminating the need for the then uninsured to have to visit emergency rooms for what should have been routine care.
It was also going to reduce costs among this group because by having insurance, they would visit doctors earlier and catch problems earlier rather than wait for the problem grow severe enough to justify dealing with the emergency room process.
Geez, nobody predicted these effects would be instantaneous, or that the savings would immediately outweigh new costs from a monumental change in the country’s biggest industry. But who thinks having 50 million or so people without health insurance is an efficient way to operate that industry? The burden of proof is the other way around, since the contrary argument is obvious nonsense.
Another straw man argument. Seems to be the modus operandi here.
So Mr.Kimel’s entire basis for his posts, this one and the former one, is that he:
“expect[ed] to see if 2010 marked the passage of a law that bent the cost curve. Or rather, not like a law that bent the cost curve in the right direction.”
He expected the annual % changes to do what by when?
Since the ADA was designed to dramatically increase the number of people who couldn’t afford health insurance by providing Medicaid funding to get them health care, while at the same time putting in place conditions to insure people with “prior conditions” could not be refused insurance any longer, and putting new regulations in place to stem the not inflation caused increases in Health Care per Capita, then precisely what were Mr. Kimel’s expectations, and more importantly where did he come up with his expections..
As I’ve already shown
Real Per Capita Expenditures
increased at the rate of
Overall: $139/ person / Year from 2001 to 2014
2001-2004: $283 / person / Year
2004-2009: $131 / person / Year
2010-2014: $ 90 / person / Year
Which is precisely the same data and the identical source (FRED + CPI-U inflation) of data from which Mr. Kimel shows % change per year.
Did costs/capita decease with time after the ACA?
Yes, they decreased by 31% from the rate of the previous period.
Each period, if you chart the costs/capita are clear and distinct from one another… three distinctly different linear slopes of health care per capita per unit time.
I think Mr. Kimel doesn’t understand that the rate of INCRFASING costs/capita were extremely high from 2001 to 2004. They were increasing at the rate of $283/person/year. Then the rate of increase in costs dropped to increase at a slower rate of $131/person/per year from 2004 to 2009.
Then after the ACA was signed and the “official” end of the Great Recession from 2010 to 2014 the rate of increasing health costs dropped again to increase at the lower rate of $90/person/year.
Does Mr Kimel think that if the rate had continued to increase by $131/year or prior to that by $283/person/year that health care costs were going down?????
He shows a chart which the layman or person who doesn’t really know what % change per year means in real costs slopes increasing will misinterpret to think health care costs should be lower now than before.. but that’s not what the ADA said would occur. What the ADA said is that the cost rate of heath care increases would drop even by massively increasing the number of people getting health care and eliminating the “existing conditions” terms insurance companies were using to keep people with “pre-existing conditions” from being able to afford health care.
So again the real question is wtf is Mr. Kimel’s source of his “expectations”? Did he make them up out of thin air because that’s what he wanted to believe about the ADA?
Let me try to make the picture crystal clear, but I have to do this without the visual advantage of a chart. (commenters can only post text).
Picture a curve on an x-y chart where the x axis is year number and the y-axis is Health Care Cost/capita in Real terms (inflation adjusted terms) to 2014 dollars.
The curve starts at the 1st year on the far lower left of the chart…. year 2001.
The Cost at that time is $5666/person.
Then go to the 4th year which is 2004. The Cost at that time is much greater…. it’s $6514/person.
In between those two points the costs increase linearly between the two points. So the Cost curve per unit time is pointing UP… the rate of UP is ~$283/person/per year.
Now go to the year 2009… this is the 9th year from the left end of the chart.
The Cost at 2009 is $7217/person. So very clearly the costs are continuing to increase from 2004 to 2009.In fact they increased from $6414 per person to $7217/person between 2004 and 2009 or by $1203/person over the 5 years from 2004 through 2009. The data points between 2009 and 2004 lie almost exactly on the line connecting the points’ at years 2009 and 2004..
If you divide $1203 (the total increase over 5 years) by the number of years, you get $131/person/per year. This is the rate at which costs/person has been increasing form 2004 to 2009.
So quite clearly a) the cost per person is higher in 2009 than in 2004, but the rate at which costs are increasing is now much lower than the rate they were increasing from 2001 to 2004 (in fact the rate of increasing health care costs dropped by over 50%).
Now go to the year 2010 on the x-axis. that’s 10 years to the right fro from the far left end.
At that time (2010) the cost was $7241/person which is higher than it was in 2009 by < $25. I use 2010 costs because that's the year the ADA passed congress but nothing had been implemented…. the only thing that occurred in the heatlh care industry is that every health care provider and state started changing things to be able to deal with the new law. Some states way they dealt with it was to file a lawsuit to get the law turned over by the courts. That didn't work.
So now go to the year 2014 which is 14 yeas from the left end of the x-axis.
At that time the cost was $7674/person. which is clearly even higher than it was in 2010 by another $433/person. The data points between 2010 and 2014 lie nearly perfectly on the line connecting the cost in 2010 with 2014.
Now divide the increased cost of $433/person by the number of years between 2010 and 2014 or 4 years. That's an average annual rate of increase costs of $90/person/year.
So the rate at which costs were increasing from 2010 to 2014 was a lot lower rate than occurred from 2004 to 2009 (which was at a rate of $131/person/year.
IN other words the curve is bending over from bottom left tto top right beginning at a steep rate on the lower left of $283/person/year rate of increasing health costs, then bending over to $131/person/year in the middle of the curve and finally bending even further to a cost growth rate increasing at just $90/person/year…. a far cry from $13/person/year and even further cry from $costs increasing a the rate of $283/person/year beginning in 2001.
Mr. Kimel apparently doesn't like this form of what the data actually shows in the cost curve ending over which is why he won't show it in this form… but he had to have it in this form first in order to even get to the % change per year he shows.in his chart.
So it's quite clear, or should be quite clear by now that Mr. Kimel is showing his chart for some ulterior motive than to show the actual rates at which the cost curve has been bending over despite increasing the number of people insured and removing the pre-existing conditions limit on who could afford insurance.
That's the best I can do limited to text and no visual graphic chart. It should however be conceptually clear if you followed the text by putting points on an x-y chart on a napkin in front of you.
Emichael,
I have felt it coming since day one of his prior post.
Either that or he’s trying to show some right wing interpretation of the ACA, which I’m relatively sure indicts all the Medicaid recipients being black and Hispanic and therefore costs didn’t drop because of “those people”.
urban legend,
Actually – run had a piece citing Maggie Mahar in 2012 in which there was this quote:
This is not a criticism of Run or Maggie Mahar, both of whom do great work and both of whom know a lot more about the topic than I do. It is merely noting that this view of what would happen to costs, pushed by the White House, was widespread. A lot of people trusted the White House.
And if the White House was claiming something, don’t we have the right to check how it turned out? Its been 6 years and chance since PPACA was signed and three since the provisions referenced above kicked in, and those provisions were, as per the quote I provided, going to have an effect on costs well before they kicked in. At what point does it become fair to see if it bent the cost curve as promised?
Tooth,
Your numbers miss the context that the graph provides. I put up the graph because the averages are misleading. Purposely so. You are relying on readers not being able to tell the difference between a positive and a negative second derivative. A car accelerating from zero to 60 and a car slowing from 60 to 0 may have the same average speed over the intervals in question, but what is happening to the vehicles and their passengers are two very different things.
As to my purpose here… I have already mentioned it in the last post. I am working on something unrelated to the blog. In the course of that project, I stumbled on a quote from the time about the effects that PPACA was going to have. I was curious as to how that quote turned out, and I did what I always do when I am curious – I went looking for data. FRED is a nice default site because it produces graphs with little work, so I started there. The three resulting graphs appeared in the last post.
Mike:
1. What was one of the things I said about the ACA and costs?
2. In my post Healthcare Drivers, I pointed out one particular aspect of the cost of healthcare towards the end of the post.
I believe we added upwards of 32 -50 million people to healthcare who were previously uninsured. The vast majority of them were enrolled in Medicaid or private healthcare insurance beyond 138% FPL. Total Cost increased based on the numbers previously uninsured.
I assumed you used the inflation rate for 2016 and worked backwards? This can also be found on one of the links too.
Neat little KFF article here: https://www.kff.org/medicare/issue-brief/the-facts-on-medicare-spending-and-financing/ PHI projected to grow at 4.9% and Medicare /capita at 4.5%
Kimel,
Your thought that the 20 million people who received healthcare from the ACA all received the same amount of healthcare before the ACA is simply incredibly stupid.
Yes, they went to the ER during emergencies and received care. Not anywhere near all of them, and not anywhere close to the same care levels.
You have taken little pieces of info and morphed them into a fiction that is simply your meandering thoughts.
ASN President Eleanor D. Lederer, MD: Unquestionably, passing a bill that cuts hundreds of billions of dollars in Medicaid and adds 22 million more people to the ranks of the uninsured—as the Congressional Budget Office has estimated the Senate bill would do—will result in substantial consequences for individuals with chronic disease. Any time you delay or interrupt care for people with chronic illnesses, such as kidney diseases, you miss an opportunity to intervene favorably and increase the chance of a negative complication. The result is an increased burden of those illnesses on the individuals and on the costs to the health care system.
Since Medicaid expansion began under the Affordable Care Act, 32 states and the District of Columbia have taken the opportunity to add 11 million new people to the program. Today, nearly 50% of all Medicare fee-for-service beneficiaries with kidney failure are covered by Medicaid. In comparison, just 19% of the general Medicare fee-for-service population qualifies for the program, reflecting the socioeconomically disadvantaged status of many of the patients we nephrologists care for.
That is why I am concerned that if federal support for Medicaid is eroded in a transition to “block grants,” states will face difficulty making up the difference and the disastrous effect on access to care would likely fall disproportionally on this vulnerable kidney patient population.
NN&I: What do we know about the impact of delay in care for individuals with chronic kidney disease?
Lederer: As nephrologists, we already know that the longer care for chronic kidney disease is delayed, the more likely a patient is to progress more rapidly to late-stage CKD and possibly to complete kidney failure. Moreover, these patients present in kidney failure without an opportunity to consider a pre-emptive kidney transplant or to make plans for dialysis. They initiate dialysis using a temporary vascular access, leading to greater risk of infection, greater number of hospital days, and inferior survival. They are some of the most complex and costliest patients in the system.
Longer nephrology care before kidney failure is linked with better patient outcomes, including significantly lower mortality rates. Northwest Kidney Centers (NKC), in the Seattle area, recently shared some data supporting the idea that the Medicaid expansion has made a difference in accessing nephrology care early in the disease course.
Prior to expanded Medicaid, 21% of new NKC patients had never seen a kidney doctor before starting dialysis. But, by 2015, that number dropped to 14%. Nationally, that percentage has dropped from approximately 30% to less than 25%.
https://www.nephrologynews.com/senate-health-care-bill-can-big-impact-kidney-disease-patients/
Mr. Kimel,
Precisely what “numbers” are misleading?????
The answer requires three very specific elements:
1. It requires one to define the “truth” in order to define “mislead” [one away from the truth].
2. That requires defining who or what is the source of the truth you claim in 1).
3. It requires the source of “numbers” that direct the reader or analyst away from the truth as defined in 1) and 2).
I don’t have a clue what you call truth in the context of healthcare costs, and thus what you refer to as being misleading from it, much less how your “numbers” support what you refer to as misleading from the truth.
Can anybody on this web fill in the specific answers to items 1), 2) , and 3) above? Mr Kimel hasn’t yet done so in his plethora of comments, nor in either of his posts.
In 2013 the administration was happy to make claims like:
So why was it OK to tout changes in real per capita healthcare spending in 2013 (using estimated figures) but not OK to use that measure (using actual figures) a few years later?
Was anyone at this blog calling the admin morons for using that measure when they thought it made the program look good, or is it only a problem now when things don’t look so good? As I stated before, this seems very reminiscent of how Republicans debate on taxes – there’s always a good reason for not attributing slower growth that follows the tax cuts to those tax cuts. On the other hand, it is always OK to say the tax cuts boosted the economy based on no evidence at all.
Mike:
If you “had” read the article, you would see the reasons for what they attributed the slow down. First, you were saying the initial chart showing the growth in healthcare spending was only attributable to Medicare. At that point, it became obvious, you had not read the article carefully. The numbers themselves are from the CMS which I had to struggle to get you to even look at in the links. “Since 2010, when the Affordable Care Act was signed, health care costs rose by 4.3 percent a year. It achieved its goal of lowering the growth rate of health care spending. “ This was accomplished through a variety of different actions taken with hospitals and doctors changing methodology. The big nut of regulating the costs of Pharma, Procedures, hospital supplies still needs to be cracked along with the services for fees practice employed by doctors.
From 2017 to 2026, the average per capita rate of growth is projected for Medicare to be 4.5% and 4.9% for Private Healthcare. the facts on Medicare Spending.
Your mention of tax cuts and Repub lies is a non sequitur to the issue at hand here especially when one looks at the millions of people who gained healthcare without spending dime one which is far less than the $2100 Obama said costs would be reduced. Millions of people are getting free healthcare through Medicaid, Medicare, and the exchanges. Other people are getting subsidies up to 400% FPL. The people getting pimped today are in the individual market above 400% FPL.
Besides explaining why Healthcare slowed, the original article also gave other reasons why healthcare growth slowed in the far right column. The article and chart were pretty straight up. Kaiser uses the CMS numbers Mike. There are any number of other authorities who recohnize the slow down in the growth of healthcare costs
“per capita .”
Incredible you keep saying this.
ah
“Health Care spending growth is the lowest on record”… in 2013
(btw the link to the “white house claims” comes up with a white house web page saying the link “Cant be found”.)
Growth is a rate measure of magnitude over time in this case. Frrom 2010 (ACA bill passed) to 2014, including or even ending in 2013, spending growth was ~ $90/person/per year…. this was far lower tthan the prior growth rate from 2004 to 2009 which was ~ $131/person/year, and that was even far lower than it was from 2001 to 2004 which was ~$283/person/year.
Conclusion the statement is true by all measures.
“According to the most recent projections, real per capita health care spending has grown at an estimated average annual rate of just 1.3 percent over the three years since 2010.”
The source of these “projections” in real per capital dollars in 2013 is not provided in the statement, so it is unclear what kind of projections are referred. Assuming for the sake of argument that the “projections” have merit, then
“…real per capita health care spending has grown at an estimated average annual rate of just 1.3 percent over the three years since 2010.”
According to the data on nominal health care Expenditures (spending) from 2010 to 2013 uplifted to 2014 dollars by CPI-U, the average annual growth rate is 0.96%.. I used 2014 dollars but since 2014 CPI-U (0.8%) was lower than 2013 (1.5%), then the 0.96% average annual growth rate would be slightly higher taken using CPI-U uplift from 2010 to 2013 than from 2010 to 2014….1.3% to the nearest 10th is not out of line.
But if I use 2013 dollars the average annual growth rate from 2010 to 2013 is only 0.07%. This is far below the estimated 1.3% so the estimate is based on PROJECTION made in 2013 about what the rate of inflation would be in 2013 AND the Actual Health Care spending dollars in 2013.
So we now know the context of the statement and the “according to projections” preface. As it turns out the actual real average annual health care spending growth was 0.07% even far less than the projections estimated and even including 2014 the actual average annual growth from 2010 was 0.96%.. call it 1.0% to the nearest 10th. which is still less than the estimate made in 2013 for 2013.
So white house statement Mr. Kimel refers to is both completely correct, and was even far more pessimistic than the facts now show to be the case after 2013 data was available. Make note that white house said up front it was an estimate based on a projection.
Neither was the statement even a tiny bit untruthful nor was it misleading or even a veiled attempt to mislead.
Indeed from 2010 to 2014 the actual rate of growth in Spending was $90/person/year which was a far lower growth rate than it was from 2001 to 2009
So Mr. Kimel cites a statement from the white house made in 2013 which projects the rate of spending growth rate from 2010 through 2013 will be far lower than any time before… even over estimating the number relative to the actual growth rate as it turned out.
And Mr. Kimel says this statement was misleading and “touting” when in fact they were not misleading and even over -estimated the actual growth rate from knowledge of subsequent years.
Indeed, the average annual growth rate from 2010 to 2014 after all the numbers were in sometime in late 2015 show that it was 0.96% or to the nearest 10th 1.0%. from 2010 to 2013. The annual growth rate values were “over the 3 years since 2010″… as per the white-house statement’s time period.
2011…. 2.44% (growth from 2010)
2012….. 0.34%
2013….. 0.09%
So who’s misleading here? The Whitehouse statement or Mr. Kimel?
Mr Kimel stated the White House was misleading. but Mr. Kimel lied outright in black and white since he can and I’m sure has done the arithmetic himself of what the average annual growth rate was… this is simple arithmetic … roughly I’d guess 4th grade or at most 5th grade level . It’s quite clear from the facts at the time and since as well that the data shows the white house neither misled nor “touted”.
The actual figures “a few years later” confirm in spades the white house statement both then and since then.
What Mr. Kimel may be referring to is the real growth rate from 2013 to 2014 was 3% and that if you use that figure to include it in the average annual growth from 2010 then the value is 1.47% or 1.5% to the nearest 10th. This slightly greater than the White House estimate for 2013 (1.3%) but not at all out of range for a valid estimate by any stretch
All the white house statement really said is that since 2010 the real average annual growth rate in costs was lower than it had ever been… .and supported it with an estimated growth rate .. which turns out to be an over estimate in 2013 and an insignificant deviation from actual by 2014 (which couldn’t be determined until late 2015).
Just for comparison the average annual growth rate from 2001 to 2010 was 3.1% in 2014 dollars, so the growth rate after 2010 was half that in 2014 dollars.
Just as the data I showed which was that from 2010 to 2014 the growth rate was $90/person/year while it was $283/person per year from 2001 to 2004 and $131/person/year from 2004 to 2009 substantiates what the white house statement said..
Maybe Mr. Kimel’s now decided to use Alt-arithmetic..
Just to be complete,
The annual growth rates from 2001 to 2009 inclusive were:
6.2% 2001
3.7% 2002
4.5% 2003
2.1% 2004
1.9% 2005
2.8% 2006
-0.3% 2007
3.9% 2008
0.3% 2009
The average that period was an average annual growth rate of 3.1%.. over 3x what it was after 2010.
What Mr.Kimel seems to be focused on are two individual years of real growth … in 2007 and 2009.
But in 2007 the inflation rate was 4.1% which was the highest rate of inflation from 2001 to 2014 by far. This causes the real growth in 2007 to be much, much larger than in 2006 and so when inflation resumes its normal trend in 2008, the real annual growth in 2007 is far lower than trend an is purely a function of the abnormally high inflation in 2007… way outside of the normal trend..
A similar though lesser effect is observed in 2009. when inflation was 2.8% and that was 2.8x greater than it was in 2008, forcing the 2009 annual real growth 2009 to be abnormally low…. also a pure function of a gross change in inflation.
The average inflation rate (CPI-U) from 2001 through 2014 (after excluding the abnormally higher rates in 2007 and 2009) was 1.94% so you can see that the 4% value in 2007 and 2.8% value in 2008 were not in the normal range over that period.
Mr Kimel makes no effort to explain why the health care growth rates in real terms in 2007 and 2009 were abnormally low however. This is another of his intentional misleads by not explaining these rates as being due to the large deviations of inflation in those years even though he can say he is “technically correct”…. they were the result of compensating for inflation’s effects to obtain the real costs in 2014 dollars… that is true.
That they are something to focus on however in the changes in health care cost trends before and after 2010 is what he’s using to mislead.
This is not how professional economists analyze information and explain what’s happening.
Oh, now I get it…. Mr. kimel lies by saying the admin “touted” and misled the public about the health care cost changes that were real as was clearly true in 2013 from 2010, and then uses that lie to ask whyt it’s not OK for Mr. Kimel? or is he referring to the administration? using the same measures a few yeas later.
“…was it OK to tout changes in real per capita healthcare spending in 2013 (using estimated figures) but not OK to use that measure (using actual figures) a few years later?
Huh???
He calls the administration out for touting and misleading in 2013 when they didn’t at all (see my prior two comments) and he then focus’s on 2 abnormally low rates in health care cost growth in 2007 and 2009, as being indicative of much lower growth rates in heallh care costs BEFORE the ACA bill was passed in 2010 to mislead by saying the growth rates after the ACA passed were not any better than before the bill passed. .
His whole and entire objective is to say the ACA made no real difference in health care costs… which by the way is the precise propaganda line used by the far right wing.
He then entirely ignores the fact that millions more people in the lower economic classes received health care that they couldn’t afford before the ACA as having any relevance to per capita health care costs… when he knows full well that millions more received health care for extended periods by physicians that they didn’t receive before (other than by occassional emergency room visits which actually drove health care costs far higher). .
This is no different than everything else Mr. Kimel has posted about… he takes a narrow, and always right wing point of view and then selectively cites data supporting that point of view without showing or acknowledging the full picture and contraindicating sources of data that negate his point of view.
This is what a propagandist does.
BTW, I understand fully what Mr. Kimel has always done in the past posts and now understand what he’s also doing in this case.
What I don’t understand though is he uses AB to do it or why he does it at all?
The best I can tell is that he’s trying to influence the unwary AB readers to accept and believe his obviously clearly narrow right wing point of view. Mr. Kimel may or may not be a registered democrat as he says he is, but he’s clearly not of the left of center political persuasion or even a centrist right side of the political space.
A simple question on his view of the ACA and health care costs is simply to ask:
Is the ACA better than all prior health care policies in the US for the general good of the public and nation’s costs? A simple “Yes” or “No” would suffice as answer.
Even moderate leftists agree from day one that it isn’t by far the best that could be done (note European’s costs for better and more health care), but it’s far better than we’ve ever had before.
Three points on different time scales. On the shortest, healthcare has a lot of fixed costs. When recessions cut the number of insured, costs rise to cover them, but ease back as more return to work and are covered again. Intermediately, you have to be careful what you call the ACA. It was initially successful, but the failure to expand medicaid and the more recent attempts to sabotage the markets are resulting in higher costs. Costs in states not expanding medicaid increased about 1% more than those in states that did and we can expect more of this from more recent actions. Also healthcare has time to accommodate to changes over time, lessening their effectiveness. Long term, the population is getting older which increases costs even without price increases.
Run,
I think it makes sense to ignore the projections as those don’t have a tendency to come true.
What’s left, after all is said and done, is a graph that uses a measure the Obama administration itself used. The graph shows (for various reasons, including those you pointed out) that the measure the Obama administration used is not behaving in the way that it was when the Obama administration chose to use that measure.
Lord,
Thanks for the reasoned comment. You are correct. Which is all the more reason to get this right (not that I have faith in the current administration on this regard) since its vital to the country’s future.
Mike:
The initial data is historical and going out to 2016: Historical and these are not projections.
The next set is Projections from 2017 to 2026: Projections
The initial paragraph is oddly worded. Indeed though, historical and projection are broken apart. If you click on each subtitle Historical and Projections, you will get the definition. I have an article to finish for a Consumer Org on Opioids and Pharma. You did distract me for a bit.
Run,
I know the data through 2016 is actual. When I said to ignore projections, I meant this line that you wrote:
Mike:
I just wanted to make sure so you did not run around with false data. Pretty tired, caught a bad cold, and being a Company Director is busy work. Brought in $20 million in business this last year. Another year older in another week. Leaving the sixth decade behind in another year.
There is also a Deflator Index there.
Kimel is dishonest as the day is long.
It’s pretty simple to explain. Between 2010 and 2013 the ACA began rolling in cost saving reductions such as cuts to Medicare reimbursements rates and cuts to Medicare Advantage subsidies. Spending was curbed so the growth rate was reduced.
But in 2014 the ACA began spending $120 billion a year in medical services for 20 million people. Gee, Kimel, do you think a sudden $120 billion of new medical spending might cause a one-time jump in medical spending. Where’s the mystery? 20 million more people are getting medical services costing $120 billion dollars. If the ACA is suddenly increasing spending by $120 billion, how could it not affect per capita spending?
Note that that denominator was constant. There were no more people in the U.S. But 20 million more of them were getting medical care costing $120 billion. Denominator is constant, numerator goes up. Therefore spending per capita went up in 2014. Spending also went up a little more in 2015 as a few million more were added to the spending.
Why are you do stupid to understand this simple fact?
And in the years after 2015 neither the numerator or denominator changed a whole lot so the year over year increase fell back to lower rates pre-2014.
Let’s say there were only two people in the country in 2013. One spends $1000 a year on healthcare and the other spends $0. The per capita spending is $500. In 2014 the ACA provides $1000 of healthcare to the person who previously had none. The spending per capita suddenly jumps to $1000. But in 2015, nothing changes so the year-over-year change in cost per capita drops back down to zero.
That is effectively what you are seeing on your graph. In 2014 and 2015 there is a spike in YoY per capital spending as people are added to the ACA spending. This one time change then declines after 2015.
This is such simple math that it’s hard to believe that you can’t understand it. But I suspect the ignorance is willful.
Nice post, BillB.
“Why are you do stupid to understand this simple fact?”
Because charts.
Reminds me of the charts of He Who Must Not Be Named regarding climate change. Give an ideologue a chart and he can make it show anything if he cares to ignore what he wants to ignore.
BillB,
I sense the opportunity for a win-win here. You can prove me a liar in your head by finding something I can use for my outside project. If you can locate a projection from the white house or any other government source that is contemporaneous with or from just before the PPACA was passed that shows this obvious thing I dishonestly refused to account for I’d appreciate it.
To be specific – we need either a forecast, or at least a description from the time which was presented to the public showing that the administration expected real healthcare expenditures per capita to decline at first, then rise around 2014 for a few years, and then shrink down (roughly what year?) after that.
In fact, anything resembling the graph I posted, of course with the curve dropping below zero some years out would be ideal. Even more ideal –
that would be a curve or description that was widely publicized at the time. That way you would definitely show that all of this was known ahead of time, sold that way to the public, will turn out well, and that I am lying about the whole thing. Otherwise you’re just trying to justify something that is obvious in retrospect but was either swept under the table or not even foreseen when the whole thing was passed. Sort of how Republicans talk about the effect of tax cuts on the economy years after the fact.
That you will not do your own research bothers me. As I have pointed out repeatedly, no one ever stated the ACA would reduce the cost of the components of Healthcare such as Pharma, hospital supplies, and the service for fees practice. Indeed, it was written into the law that Part D, Medicare, as well as the ACA could not negotiate with Pharma. Given what I just said, I pointed out in Healthcare Drivers what the recent trends were from 1996 to 2013:
Another article, I read the other day gets into the foundation of what is happening based upon a recently completed study by JAMA. Using this study, the Methods Man, Dr. Perry Wilson (MedPage Today) examines what is driving healthcare costs in his article Here’s What’s Really Driving Healthcare Costs using data from Factors Associated With Increases in US Health Care Spending, 1996-2013 and the US Disease Expenditure Project. Dr. Wilson breaks it down using three simple charts which I have consolidated to one.
Dr. Perry Wilson starts off making an overall point about the rising cost of healthcare from 1996 to 2013 and stating;
Going on:
Different chronic diseases have different patterns of price increases. The biggest increase was seen in diabetes care, as you can see here, driven largely by the rising costs of pharmaceuticals.”
The Chart breakdowns reveal the various impacts of healthcare costs moving from left to right and then downward:
• 50% of the increase in healthcare costs was simply due to higher prices.
• Inpatient care or Service Utilization (purple) went down from 1996 – 2013 as outpatient treatment increased; however, the price of the remaining inpatient care went up much more – increasing overall inpatient care spending by around $250 billion.
• Different Chronic Diseases have different patterns of price increases. The biggest increase was seen in diabetes care and driven largely by the rising prices of pharmaceuticals.
The takeaway drawn by Dr. Perry Wilson: “Regardless of the disease, it is clear, the price of what we’re buying – whether a drug, an ED visit, or a hospital stay – not the amount of what we’re buying is the major driver of cost increases. Efforts to reduce the consumption of healthcare may not bend the cost curve as much as efforts to reduce its price.”
This second graph comes from an Urban Institute Executive Summary. Here is there comments:
“In this report, we update our previous analysis by comparing the most recent CMS forecast, released in July 2015, to the 2010 ACA baseline forecast. The 2015 forecast incorporates the Medicare Access and CHIP Reauthorization Act (MACRA), which permanently eliminated the sustainable growth rate system for setting physician payment rates in Medicare; our earlier work used CMS forecasts that assumed adherence to the sustainable growth rate system. Here, to be consistent with the most recent forecast, we use an adjusted ACA baseline forecast that assumes a rate freeze for physician payments rather than the cuts projected under the sustainable growth rate system.
Using the 2015 forecast, we find that projected national health spending for 2014 to 2019 had fallen by about $2.6 trillion since the 2010 ACA baseline (figure 1), reflecting large declines in Medicare, Medicaid, private insurance, and other health spending projections. Thus it appears that the US continues to be on track to spend much less on health care over the next several years than projected in late 2010.” You can download the entire report yourself off of the executive summary.
Kaiser using similar data drawn from the same Altarum Institute can supply you with more historical data. Assessing the Effects of the Economy on the Recent Slowdown in Health Spending
What you are doing here is what Republicans do. They tie up people with half truths, innuendo, supposition, conjecture, and lies conveniently cherry picking statements out of context. I resent your doing this and you should find another venue if this is how you will write.
READ WHAT IS ON THE LINKS.
“He may look like an idiot and talk like an idiot but don’t let that fool you. He really is an idiot.”
― Groucho Marx
Sheesh, Kimel. Congress passed a law, the ACA, which increased spending on healthcare by about $120 billion a year. They also passed new taxes to pay for that $120 billion a year. This was to provide insurance for about 20 million people who previously didn’t have health care.
Pray tell. Do you think anyone was unaware that healthcare spending was going up by $120 billion? Why would they pass taxes if they didn’t think they were going to be spending more money?
Why are you hung up on this spending per capita thing? It’s pretty obvious to everyone that if you increase health spending by $120 billion and you don’t increase the number of people in the U.S. that per capita spending will go up. How could it not?
The one time anomaly occurs, because unlike the rest of the developed world, the U.S. had 13% of its population without health insurance. This artificially depressed the (average) spending per capita. When you suddenly provide health insurance for 20 million of those people, per capita spending goes up.
What this means is that per capita spending for health care, compared to the rest of the world, is actually much more expensive than old statistics showed because a significant percentage of the population was not spending like everyone else. It made the (average) per capita spending seem lower.
BillB
indeed Mr. Kimel is “As Dishonest as the day is long.” but anybody reading his junk already should have figured this out long ago.
I’m as dismayed and disappointed as ever that AB has continued let this guy post anything at all.. imo its degrading to AB’s image.
Mr. Kimel’s posts aren’t and have never been about expressing his opinion.. they’ve always only been about spreading right wing propaganda. FUD is a great tool.. Uncertainty and Doubt create fear with just a tiny nudge or innuendo.
(Mr. Kimel will protest by telling us again that he’s a Democrat, but that’s neither here nor there — it’s what he posts that tell what he believes or wants others to believe based on selective information and his refusal to acknowledge the validity of the rest of the information that refutes his selective sources (causations).)
Maybe Mr. Kimel has no sense of perspective so he lives in his own shell. Does he even know that federally sponsored full health care has been on the liberal’s agenda since Teddy Roosevelt’s time?
“U.S. efforts to achieve universal coverage began with progressive health care reformers who supported Theodore Roosevelt for President in 1912, though he was defeated. Progressives campaigned unsuccessfully for sickness insurance guaranteed by the states.”
https://en.wikipedia.org/wiki/History_of_health_care_reform_in_the_United_States
Does he even know that FDR tried to get universal health care in the SS bill?
“With the Great Depression, more and more people could not afford medical services. In 1933, Franklin D. Roosevelt asked Isidore Falk and Edgar Sydenstricter to help draft provisions to Roosevelt’s pending Social Security legislation to include publicly funded health care programs. These reforms were attacked by the American Medical Association as well as state and local affiliates of the AMA as “compulsory health insurance.” Roosevelt ended up removing the health care provisions from the bill in 1935. Fear of organized medicine’s opposition to universal health care became standard for decades after the 1930s.”
The ACA is the first instance of liberals finally getting even a semblance of the objectives into law in the U.S. in over 100 years of trying.
And here we have Mr. Kimel nit-picking on what the Obama admin said . or didn’t say to be more precise, as if Mr. Kimel just became aware of the ACA’s financing and costs only AFTER Trump admin began to unravel it.
If I don’t miss my guess, Mr Kimel picked up on the Obama admin’s statement(s) or lack of them and the right wing blogosphere’s castigations from one of Mr. Kimel’s right wing news feeds (that he always says “I just happened across this.article.”)
And it was Truman who was the first president to officially (with legislation) propose a national health care system.
“In 1945, he became the first president to propose national health insurance legislation”
https://www.cms.gov/About-CMS/Agency-Information/History/Downloads/PresidentCMSMilestones.pdf
So does Mr. Kimel even understand the Obama Admin’s significance of accomplishment? or find it beneficial to the overall benefit of the majority of citizens… especially the poorer half?
If so then why does he nit-pick on what Obama’s admin didn’t say (that Mr. Kimel’s aware of that is).? but then. characterizing what they did say , however, as being “misleading”?
If Mr. Kimel had paid any attention at the time he’s have known full well that health care costs were going to continue to rise… just at a lower rate of increases This was widely known and published… even discussed openly on TV interviews by taking heads.
So why suddenly IMMEDIATELY AFTER the right wing congress and Pres. attempt to negate the ACA and start taking it apart piecemeal, does Mr. Kimel come up with the fact that costs/capita increased (or that costs increased… take your pick) in 2014 (and then belatedly become aware that they also increased in 2015 from being hand fed the sources by Run… not trough Mr. Kime’s own research, mind-you).
And the link Mr. Kimel provided to the he quoted he posted in one of his comments about the administration’s statement in 2013 projecting estimates of the lowest increases in health care pending over the lats three years being the lowest in recent history… when that link leads to a White House web-site that says “link not found”.
So where did he find the quote .. who fed it to him because he sure didn’t find it by his own research… and the link doesn’t lead to it so who gave him the link that leads nowhere?l
run,
My comment was to BillB. I had already looked through the contemporaneous literature. I haven’t found what I was looking for. (The article you cite wasn’t contemporaneous either.) See my response to BillB below to see why I suspect it isn’t easy to find contemporaneous literature or statements making the point I mentioned.
BillB,
Here is Obama speaking at the signing ceremony for PPACA. He seems pretty unaware. Or at least he says nothing at all about costs except that they will go down.
He starts by talking about costs for businesses going down. The pre-existing conditions, then reduced costs for people under 26.
And it goes on, with costs going down to X and Y and Z, building to this:
As to paying for it… no mention. The word “tax” comes up three times – followed once by the word credits, once by the word breaks, and once the last time by the word cut.
When Republicans talk about the benefits of tax cuts, it works this way too: you cut taxes, the economy grows, and there’s a free lunch. Nobody is paying for the thing. It cuts the deficit and is fiscally responsible.
I am sympathetic to the aims of the ACA. Fixing the healthcare system is vital, getting more Americans access to healthcare is vital, and preventing costs from rising is vital. But from what I can tell, the selling of this program was a con job. It increased the number of Americans with access to healthcare, but doesn’t seem to have reduced the run-up of costs nor did it make the healthcare system work better. Obama may not have understood that, but no doubt some of the people who crafted this thing did. And by putting together something that isn’t living up to the expectations that were created, they created something that is vulnerable to being overturned.
Tooth,
No, Mr. Kimel will not. Mr. Kimel has pointed out multiple times that he is not a Democrat, nor a Republican, nor a Libertarian, nor a Green, nor a Peace and Freedom member, not the member nor is he associated with or particularly feel loyalty toward any of the parties that he is aware of operating in the US or abroad in reality or in fiction. I was a Democrat, and I largely I probably share more views with the Democrats of the 1990s than any other party at any other time, but as you say, that’s neither here nor there.
Here’s another of Mr. Kimel’s beauties:
In his response to urban legend, January 4, 2018 8:08 am
urban legend had admonished Mr. Kimel by saying “nobody predicted these effects would be instantaneous “,
Mr Kimil responds to this by quoting a 2012 statement from an Oncologist (Maggie Mahar): as if the qote in any way says or implies an immediate effect… which it doesn’t even remotely say at all:
“Zeke Emanuel (an oncologist and former special adviser for health policy to White House OMB director Peter Orszag) to Maggie: providers are ‘anticipating the Affordable Care Act kicking in. They can’t wait until the end of 2013: They have to act today. Everywhere I go, ‘Emanuel, added, ‘medical schools and hospitals are asking me, How can we cut our costs by 10 to 15 percent?’”.
The quote simply says that medical schools and hospitals are concerned about cutting their costs and they can’t wait until the end of 2013 to do it… (2014 being the full implementation year)..
This is another of Mr Kimel’s methods of not addressing the admonitions by other commenters that have legitimate basis and reasoning .. in this case he uses redirection to cost cutting by hospitals and medical schools who have to figure out how to do it by the start of 2014… less than 2 years from the time of the quote.
Now perhaps Mr. Kimel is terribly obtuse or maybe just letting his imagination run wild, or maybe he’s just intentionally avoiding acknowledging urban legend’s perfectly reasoned statement by inserting an unrelated “quote” as if this is “evidence” to refute urban legend’s reasoned admonishment.
It’s classic double-talk rediredtion.. a favorite method Mr. Kimel uses.
Pardon me, Mr. Kimel,
But from two prior responses me over the last two years you certainly left a very strong impression on me that you were a Democrat… or that you stated directly that you were a democrat. In fact you used those comments to me to protest that you weren’t spouting right wing talking points and ideology that I accused you of doing.
But I have never read a comment by you that stated explicitly that you were not a Democrat or even unaffiliated… I must have missed those comments somehow. That’s my bad.
Mr.Kimel,
I’ve asked you explicitly in a prior comment on this thread to define your source of “expectations” in cost reduction magnitude and time frames to achieve the “expectations”.
You didn’t answer then and now you’re making more statements about “expectations” without citing who’s precisely or your own.
Your most recent reference to “expectations”:January 5, 2018 9:08 pm
“And by putting together something that isn’t living up to the expectations that were created, they created something that is vulnerable to being overturned.”
And;Mr. Kimel does another beauty in his most recent comment January 5, 2018 9:08 pm
He links to Obama’s statement at his signing of the Bill in March 2010, and then proceeds to synopsize what Obama said:
“He starts by talking about costs for businesses going down.”
Actually he doesn’t “talk about” business costs going down atg all and he doesn’t “start” by talking about it either.. it’s nearly at the end of Obama’s comments related to what the bill will do.
“This legislation will also lower costs for families and for businesses and for the federal government, reducing our deficit by over $1 trillion in the next two decades.”
That’s the only reference to “business costs” Obama made.. “It will lower costs”
Next Mr.Kimel says “The[n] pre-existing conditions, then reduced costs for people under 26.”
What Obama actually says about pre-existing conditions is that they ae now not prevented from obtaining insurance (btw my daughter was in this category):
“This year, tens of thousands of uninsured Americans with preexisting conditions, the parents of children who have a preexisting condition, will finally be able to purchase the coverage they need. That happens this year.”
And this is what he said, all he said about “reduced costs” for people under 26.. which doesn’t mention one word about costs:
” And this year, young adults will be able to stay on their parents’ policies until they’re 26 years old. That happens this year”.
Then Mr. Kimel goes on to say
“And it goes on, with costs going down to X and Y and Z, building to this:”
But Obama makes not one statement about costs going down “X and Y and Z”…. the only statement on costs is the one Mr.Kimel quoted, which I already quoted above.. the same one in which he mentioins the word business in cost context:…i’ll repeat it again:
” his legislation will also lower costs for families and for businesses and for the federal government, reducing our deficit by over $1 trillion in the next two decades.”
So the only think Obama says about costs is that the deficit will be reduce by $1 trillion over the next 20 years.
There’s no “X and Y and Z” costs mentioned at all in any context.
Mr. Kimel just blatantly and intentionally and willfully lied about what Mr. Obama said. He posted the link expecting you wouldn’t or most wouldn’t read it..
https://obamawhitehouse.archives.gov/the-press-office/remarks-president-and-vice-president-signing-health-insurance-reform-bill
Read what Obama said yourself:
.
Dishonest Kimel just won’t quit. Exactly what was the con-job that Obama ran? Be precise. Don’t just wave you hands.
Nothing Obama said was wrong or misleading. “Fully paid for” means taxes are collected to pay for it, unlike the Republican tax cut bill which is not paid for. This was no secret. Democrats and Republicans had been arguing over the tax increases to pay for the ACA for over a year. If you didn’t hear about it it must be because you are ignorant (willfully or not).
It’s about the most honest spending bill in recent decades. We are spending this money to provide people with healthcare and we are fully paying for it with new taxes. It doesn’t get more honest than that. Hardly a con-job.
And it did lower costs for families, both those on expanded Medicaid and those who could for the first time afford health insurance due to the ACA subsidies.
And the honest CBO scoring said that the ACA was not just revenue neutral, spending equal to taxes, but it was revenue positive. That’s not a con-job. Those are real numbers.
But it was more than that. The ACA reduced the outlays for Medicare by restricting the fees that doctors and hospitals could charge.
So put it all together and it did reduce deficits by around a trillion dollars.
So where is the con-job? You are still hung up on a one-time increase inspending per capita as poor people got health care for the first time. But it was all paid for. So where is the con-job?
If you can’t discern the difference between a Republican tax bill that increases the deficit and a Democratic healthcare bill that decreases the deficit, you are beyond help. You’ve swallowed the alt-right Kool-Aid.
A follow-up… here’s a contemporaneous projections (April 22, 2010) from CMS that comes up with some figures for federal spending: https://www.cms.gov/Research-Statistics-Data-and-Systems/Research/ActuarialStudies/downloads/PPACA_2010-04-22.pdf
Basically, cost savings from 2011 to 2013 and then the costs go positive through 2019 which is the last year of the projection. So I do stand corrected, in that looking hard enough I did find one source that does start showing costs rising after 2014 or so. Projections only go to 2019, in which time the federal government will have spent a quarter of a trillion dollars on the program.
From the perspective of someone in 2010, it would be possible to square that with the $1 trillion reduction in Federal costs that Obama promised (quoted upthread) over two decades, though that would require that 1.25 trillion in savings from 2020 to 2029. But if the bump in costs in 2014 came from adding people in 2014, where is that 1.25 trillion supposed to come from in 2020 to 2029? Presumably not from reducing the number of insured beginning in 2020.
Mike:
Obama never promised a $1 trillion dollar cost reduction. I gave you the data in the links I posted and again you have failed to read them. Since 2010 Maggie and I posted numerous articles on where costs saves were supposed to come from with the ACA. Since then the Repubs have thwarted the efforts of Obama. You did not bother to read any of it. Again, you are asking someone to do your Research for you. I am not going to do it.
Ha!
“So I do stand corrected, in that looking hard enough I did find one source that does start showing costs rising after 2014 or so.”
per Mr. Kimel January 5, 2018 11:36 pm
“looking hard enough” from CMS.gov no less… yep, it must be really hard looking for an economist to look for information from the primary source.. What a f…ing joke..
Mr. Kimel is really incredible… literally not credible
He said:
“But if the bump in costs in 2014 came from adding people in 2014, where is that 1.25 trillion supposed to come from in 2020 to 2029?”
2010-2019 = 10 years saving 0.25 trillion est. by CMS in 2010
20 year projected savings= $1 trillion
Remainder to save = 0.75 trillion
2020 – 2029 = 10 years from CMS’s projection in 2010 (which projected only to 2019)
Required average annual savings rate to meet $1 trillion after 20 years:
= 0.075 trillion per year for the remaining 10 years to 2029.
Mr. Kimel says for the 10 years from 2020 to 2029 they have to save 1.25 trillion … which equates to a total of $1.5 trillion… not $1 trillion as was projected by Obama’s statement.
What Mr. Kimel fails to recognize or perhaps more accurately stated intentionally omitted is that the savings projected are relative to the costs of health care projected BEFORE the ACA bill and it’s full effects are realized over 20 years.
The savings are thus from the differential between non-ACA rates of rising costs of health care for the next 20 years and the ACA’s rates of rising health care costs.
As a rough back of envelope bench-mark the linear projection for 20 years from the annual costs from 2001 to 2009 = $3.64 trillion in 2029 (in real 2014 dollars) and a sum over the 20 years = $59.33 trillion.
The linear regression Rsquare = 0.9797 so the rate of actual costs growth is pretty solidly linear in real dollar terms.’
So a $1 trillion savings is $1 trillion / $59.33 trillion = 1.7% over 20 years… an average of 0.084%/year. That isn’t a high bar for federal gov’t savings to exceed as a % of rapidly rising health care costs based on business as usual. In fact I’d guess it’s highly understated or that the projections assumed some other factors would have bent the business as usual cost curve down instead of linearly increasing.
For an economist to not be able to do this simple rough benchmark based on the most recent 10 years of rising health care cost before the ACA is incredible…. literally not credible !!
Furthermore where is Mr. Kimel coming up with a total of $1.5 trillion savings over 20 years (0.25 estimated to 2019 + his own $1.25 additional savings required from 2020 – 2029) ??? Did he just bump the stated savings by 50% !!! and why would he do this miraculous jump with no foundation to support unless he were intentionally lying and misleading?
And he’s supposedly a degreed and formerly or even presently practicing economist? I dont’t doubt he’s a degreed and experienced economist, but then why the lack of using that education and skills unless he’s willfully obfuscating and misleading?
run,
As I noted upthread, he said, at the signing statement to PPACA.
That isn’t a dollar cost reduction, of course – the money has to come from somewhere and could easily come from taxes. According to the Joint Committee of Taxation reports from the time, it actually does that.
So you are correct… the administration wasn’t promising this would actually do something to reduce total spending on healthcare (share of GDP, or dollars per person) which was the mistaken assumption I started with. I was looking healthcare spending / GDP by country right before I pulled the graphs in the first post and that was on my mind and that was a mistake. It does raise a point, though… this is going to increase the massive disparity that already exists between US spending on healthcare and everyone else.
Ya’ think you could have figured this out earlier and not wasted everyone’s time?
geez
Stay away from healthcare.
“Ya’ think you could have figured this out earlier and not wasted everyone’s time?”
It’s even worse than that. He didn’t just make an ignorant mistake. He accused Obama and Democrats of a con-job. Further he said that the Democrats passing the ACA with deficit reduction was equivalent to the Republicans passing the tax cuts with deficit increases.
This false “both-sides” BS is toxic. Something has broken in Kimel’s brain if he reflexively goes there without even investigating the facts.
“mistaken assumption I started with” per Mr. Kimel
The real issue here isn’t that he made a “mistaken assumption” but that stared with an “assumed” of anything at all. Where and how does a degreed economist start with an assumption that has no foundation to support it and then build on and defend it ad-infinitum in spit of all the facts without making any assumptions?
All I can surmise is that Mr. Kimel makes up his own world in his own bubble, then assumes it’s the real world and thus “true”. This is the normal characteristic of the far right.
An honest person would have started with a post that stated “My assumption is that the Obama administration said Health Care costs would decline. What am I missing?”
And one single response would have been your starting assumption is incorrect. End of issue.
Or an objective degreed economist would have at least looked for a statement by the administration that said “health care costs would decline”. and finding no such statement would then have not even posted anything at all.
Mr. Kimel is neither honest or objective.