People Killed by Police, 2016
As a follow up to my post on homicides in 2016, I decided to combine homicide data from the FBI with figures from the police shooting database from the Washington Post. The only difficulty is that the FBI classifies people as being from Black, White, Other, or Unknown races, whereas the Washington Post breaks out other groups, such as Hispanic. Because Hispanic people can be Black, White, or Other (as per FBI classfication), it is necessary to assign Hispanic deaths at the hand of the police to Black, White, or Other to match the FBI figures.
One approach would be based on the percentage of Hispanic people who are Black, White, etc. According to the Census, 2.5% of Hispanics are Black. On the other hand, it has been noted that Black people are disproportionately likely to have negative interactions with Police. In the past few years, that has been the subject of protests. Lacking a perfect way to allocate the Hispanic figures, I assigned them to Black, White, and Other based on their share of the population that were victims of homicides. Its not perfect, and would, if anything, inflate the number of Black people killed by police. But… given the magnitude of the numbers involved, the choice of how to allocate Hispanic deaths among Black and White people will not have much of an effect on the graphs below.
With that said, here is a graph showing the percentage of Black people killed by police v. the percentage of Black people killed by someone other than the police.
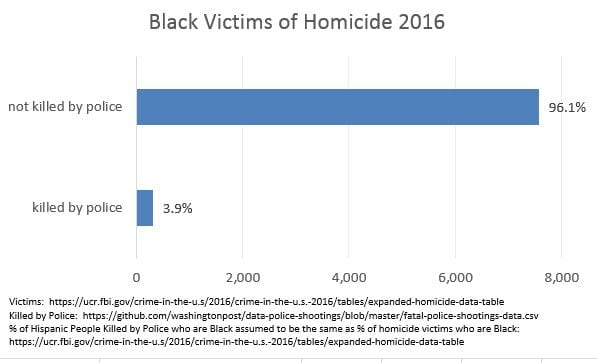
(click to embiggen)
Here’s the equivalent graph for White people.
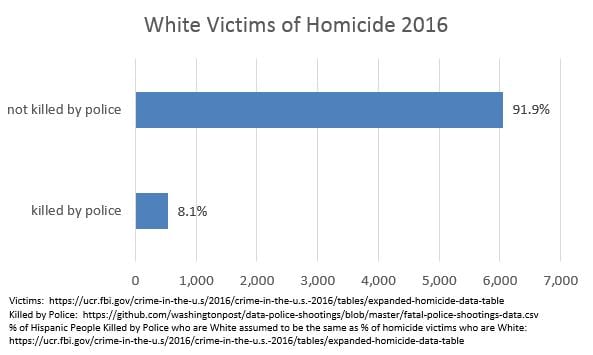
(click to embiggen)
Edit: 9:29/2017, 4:07 AM – added “(click to embiggen)” under each graph.
Number of US full time law enforcement personnel: 913k
Estimated US population: 326m.
Statistically, police are on a murderous rampage compared to the otherwise law abiding masses in the US.
With great power comes great abuse of power.
J Goodwin,
Canada is always the peaceful place people always point to when talking about the evils of the US. So let’s check their numbers for context, eh?
Data on people killed by police in Canada is hard to find but this article from early 2015 estimated it at about 25 per year. So I think it’s safe to call that the rate for the most recent completed year, which was 2014.
Statistics Canada tells that there were 521 homicide victims in Canada that year.
That is to say, around 4.8% of deaths by homicide in Canada that year came at the hands of the police.
So it’s safe to say that US police are about as out of control as the ultra violent vicious bloodthirsty uniformed thugs in Canada.
Why such selectivity, Mr. Kimel. Are you thinking Police treat blacks better than whites or have less enforcement methods with Blacks than with White,this data stat proves your thinking is right? or what?
Why not show Black and White homicides per capita deaths by police? or per Black and White male dealths per capita by police?
What does the selected data you show mean to you ..what interpretation do you make from this SINGULAR piece of data? Is it that you are trying to persuade that police are getting a bad rap based on black homicides by police relative to total homicides of Blacks and Whites?
Is there supposed to some reason that police homicide rates of total Homicides has some theoretical or rational reasoning to support some normal rate when the population ratio is at least 4.7:1?
Wouldin’t random chance alone then predict a 4.7:1 ratio instead of the 1:2 ratio of proportions shown in the charts?
Longtooth,
If we do the same analysis with males and females, males are a disproportionate share of homicide victims (11,821 M v 3,208 F) in 2016. They’re also (not coincidentally) the majority of those killed by police (898 M v. 39 F). If you do the math, it turns out that cops are responsible for 1.2% of the homicides of women, and 7.1% of homicides of men. This makes perfect sense. Males, disproportionately homicide offenders and victims, are far more likely to come into contact with the police while in a desperate situation. For example, a male is far more likely than a female to be found running down the street swinging a machete or holding hostages.
Now, let’s do a thought experiment. Don’t change the fact that males are far more likely to commit and die from homicides than women. But say police are responsible for a greater share of female homicides than of male homicides. What conditions would be require for that to happen?
Police killings (numbers, but canada has about 10% the pop of the us, germany has about 25%, japan has about 40%, uk 20%, australia 7%)
United States 930
Canada 25
Germany 8
Australia 5
United Kingdom 2
Japan 0
Fatal police shootings/law enforcement homicides per million people
United States 2.9
Alberta 1.4
Canada 0.7
Ontario 0.6
Nfld & Lab 0.3
Australia 0.2
Germany 0.1
United Kingdom 0.04
Japan 0.0
Canada, has a police killing problem. About half as bad as the US, but both countries are extremely bad compared to the rest of the wealthy world. And, getting even more specific, Alberta has a police killing problem. I don’t know a lot about Alberta.
Jeff,
Context is everything. To jump to your most extreme example, I imagine a big part of the reason Japanese cops kill so few people is that they are in Japan. From <a href = "https://www.unodc.org/documents/data-and-analysis/statistics/GSH2013/2014_GLOBAL_HOMICIDE_BOOK_web.pdf"a UN report on global homicide:
Put a different way… presumably the Japanese cops have far, far fewer instances in which they come across anyone swinging a machete or holding a gun, or who is in the process of trying to kill someone, or who is trying to get away having just killed someone. I would also guess they are far less likely to come across an armed individual who, when told to stop advancing, continues to move in the direction of the police officer. I would also guess that far fewer Japanese police officers are intentionally killed in the line of duty than American police officers.
As to Canada, and your comment about Alberta. From the same article, Alberta has the highest rate of police killings of all Canadian provinces, and the highest homicide rate of all provinces in Canada. So again… in Alberta, police are most likely to come into contact with people who are homicidal.
I haven’t gone through the data, but I believe that in this country, police kill far fewer people in areas where there are fewer murders among the civilian population. There is a reason for that.
The vast majority of cops don’t become cops because they want to kill people. Most of them do what they can to avoid killing people. Those who are lucky enough to work in places where the population is less likely to commit homicides are less likely to be in a position where they need to use force.
To be clear… “from the same article” refers to the one you quoted, not the UN doc. Apologies for the lack of clarity.
Mr. Kimel,
In response to your response to me
And then so what? of is this just like “the sun rises in the east”.
Longtooth,
You may have noticed that when you take into account the situation in the second graph, as well as Canada as a whole and Alberta in particular, or the male female example I described earlier, graph 1 describes a situation where (to use your analogy) the sun is actually rising on the west. Now, your earlier comment seemed to imply you saw no reason why the sun shouldn’t rise even further in the west. To anyone else, when made aware that the sun rose in the west, there are questions that should be answered. Particularly when everyone believes that the sun rises in the east and there are people protesting because they believe it rises in the east.