Are Poor People Consuming More than They Used To? Six Graphs
“Poor people today have air conditioners and smart phones!”
You hear that a lot. “You should be looking at poor people’s consumption, not their income. By that measure, they’re doing great.”
The basic point is very true. If poor people today have more and better stuff, can buy more and better stuff each year, maybe we should stop worrying about all those other measures that show stagnation or decline.
Does this measure tell a different story? Curious cat that I am, I decided to go see. I had no idea what I’d find.
The first thing I found: this simple data series isn’t available out there, at least where I could find it. Notably, the people who claim it’s so revealing don’t seem to have assembled it.
Consistent, high-quality expenditure data is available going back to 1984, from the BLS Consumer Expenditure Survey (CES). (Pre–2011 here. 2012 and after here. See “Quintiles of income before taxes.”) But you have to open a table for each year and pull out these numbers, which I did. The spreadsheet’s here. It’s simple, clear, and easy to work with, so please have your way with it. (Note: CES measures “consumer units” — “households” precisely defined for the purpose of measuring consumption. All the CES terms are defined here.)
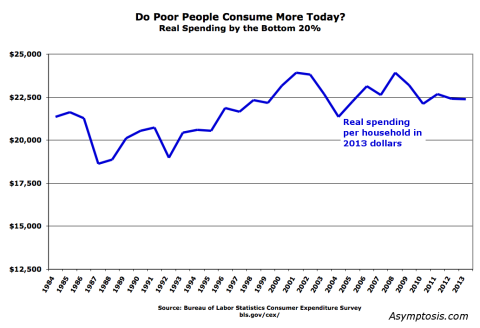
The household spending measure is in nominal dollars. I converted the values to 2013 “real” dollars using the BEA’s deflator for Personal Consumption Expenditures. Here are the results (mean values; medians would be somewhat lower).
By this measure poor people’s consumption is up 5% since 1984 — not exactly the rocket-ship prosperity growth for the poor that consumptionistas proclaim.
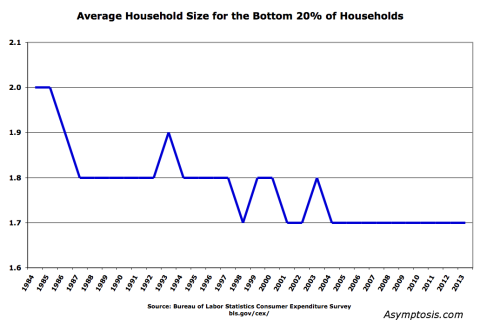
But truth be told, this isn’t a very good measure as it stands — because households have gotten smaller. For the bottom 20% that looks like this:
Declining household size means:
1. Per-person spending would trend up (if income per household is the same, with less people per household).
2. But: you have to adjust because living with more people is cheaper per person because of shared rent, utilities, etc. If you don’t, it looks like the average person in a four-person household consumes vastly less than a person in a one- or two-person household — which clearly isn’t correct.
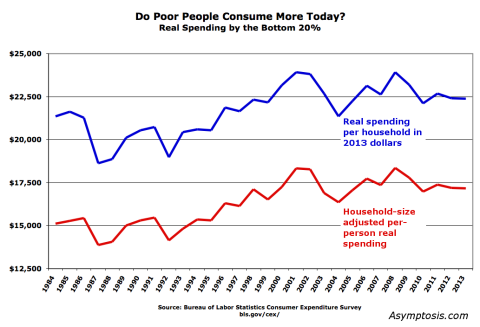
I corrected for that with the household-size adjustment method used by the Pew Research Center. This standard method is somewhat synthetic (more on that below), but it also clearly yields a more useful and accurately representative measure of poor people’s consumption. Here’s what those results look like:
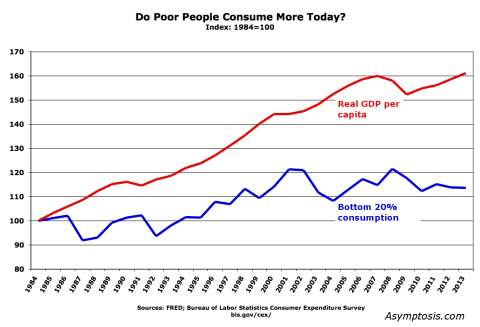
By this measure, things have gotten more better: poor people’s consumption is up 14% since 1984, compared to 5% using the other measure. But really, that’s still nothing to crow about; real GDP per capita grew 63% in that period — four times as fast.
More comparison: the real price of a share in the S&P 500 has increased 370% over that period. That’s not counting dividends.
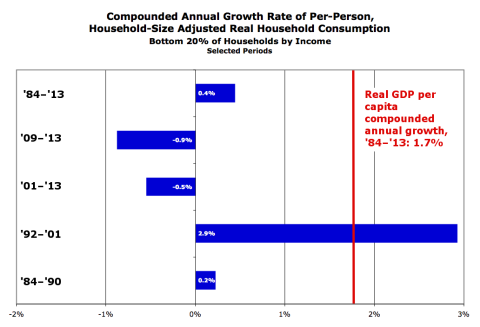
To get an apples-to-apples comparison, here’s a look at annualized growth rates for various periods:
Poor people have gained a little bit of ground in absolute terms. But they’ve lagged way behind the rest of the country. Growth in every period except the 1990s Clinton heyday was moribund or negative — notably ’84–90, the last twelve years, and (especially) the last four years of economic “recovery.”
The consumptionistas are absolutely right: this is a really good measure.
And it tells exactly the same story as the other measures.
No child left behind?
– – – – – – – – – – – –
Before I leave you, some proleptic responses to the predictable objections:
But, the Brookings study! Many point to this study (PDF) by the (liberal!) Brookings Institution. The study devises and tracks a measure they call “consumption poverty.” Here’s the money graph:

By this measure, very few people these days are living in “consumption poverty.”
Here’s the thing: this study uses the same data set you saw above. But you’re looking at it through a very synthetic lens: a somewhat-arbitrary “poverty threshold.” What percent of people are below that threshold? Which means you gotta ask: Is that a relative or absolute poverty threshold? How does it change year to year? How’s it calculated? Etc.
To say it another way: This measure is some calculation steps removed from — it’s a second or third or fourth derivative of — the data as measured by the BLS. I’m not saying it’s a bad or un-useful measure. I haven’t gone into the weeds with it. And Brookings tells you exactly how the threshold is calculated. But you have to understand the lens’s multiple assumptions and hold them in your head while you’re peering through the lens.
The graphs above, by contrast, are much closer to “the facts on the ground.” Assuming you’re interested in those.
Worth noting: the people who might prefer the story told by the Brookings poverty-threshold measure are the very same people who are forever complaining about measures that use arbitrary (and relative) poverty thresholds. Just saying.
The inflation adjustment misrepresents poor people’s reality. The “real” consumption spending in the graphs is also filtered through a lens: the BEA’s price index for personal consumption expenditures. What if that index is wrong? It is based on “hedonic” estimates, after all: what’s the value (as opposed to price) of today’s laptop compared to 1990’s? Cars are far more reliable than they used to be; knowing that your car will start every time you turn the key has real value. Air conditioning is more valuable than box fans. And think of all the free digital goods that poor people have access to now — from Google to online banking to… Those have no “pricing,” so they’re undercounted or uncounted in this measure.
This is basically saying, “you should create your own, different Consumer Price Index.” It’s exactly the same argument as the ShadowStats craziness, but in reverse: there’s not more inflation than is shown in the CPI, there’s less — more deflation. There’s a “true” index that’s misrepresented by the rather remarkable and diligent efforts of BEA statisticians.
Scott Sumner is rather the poster-child for this position. He says exactly this:
we should ignore all the official data, and use our eyes. Travel around the country. Go into poor people’s houses. … I think I do have a rough sense of the different sorts of consumption bundles purchased by different classes of people.
You should construct your own CPI index by holding up your thumb and squinting, eyeballing poor people’s consumption bundles. Because…the official CPI is not saying what Scott Sumner would like it to say.
Scott’s been going on about his superior CPI estimates for years. Karl Smith probably gave the best response, a year back:
basically anyone with MS Excel and a rudimentary knowledge of the subject matter in question can create a workable index…. a task that brilliant people have devoted their life to
The thing is, Sumner doesn’t even use a spreadsheet. He does it in his head. (Now that’s brilliant.) We should clearly do likewise, or just adopt his index — if we knew what it was.
Finally, note: the comparisons above — to real GDP and S&P growth — use the BEA’s GDP-deflator and CPI indexes, which are only slightly different from the PCE index used here for consumption. Almost-identical apples to almost-identical apples. Feel free to mess with that in the spreadsheet if you’re so inclined. It won’t get you much of anywhere.
The household-size adjustment is invalid. This is another lens interceding between you and the measured data, on top of the inflation adjustment. No doubt about it. But as with inflation adjustment, you can’t get around it. You can’t ignore shrinking household size any more than you can ignore today’s less-valuable dollars. And you can’t just divide household income by people per household, or people in four-person households look like they have vastly lower consumption than people in one-person households. That just isn’t reality.
One part you might reasonably question: The Pew size-adjustment methodology uses a chosen variable that can be from 0 to 1; they choose 0.5 based on some decent research over the years. I tried values between 0.1 and 0.9. Lower numbers lower and flatten the red line, and show a consistent upward trend from ’84 to ’01 (flat thereafter). But the basic story is unchanged.
– – – – – – – – – – – –
Look: no method is going to give you the perfect gauge of human well-being — the”obvious,” magic-bullet measure that conservatives seem to forever be after in their eternal Search For The Simple. This consumption measure is no exception. But advocates of this measurement approach are absolutely right: it’s much simpler and easier to measure than most other measures, and it’s a very good measure of how poor people are doing.
Bottom line: Poor Americans’ consumption grew, very slowly, over the past three decades. Meanwhile the rest of the country grew four times faster, and a typical stock-market investment grew at least 27 times faster.
Do with that what you will. Adjust your priors as appropriate, if that’s something you do.
Then take a look at some closely related measures that might tell other important parts of the big story:
How much of this picture is about young versus old? The population is aging; do we need to change the story this measure tells based on changing demographics?
Did poor people take on more debt to achieve that higher consumption? How has that affected their lifetime well-being?
How much of that consumption growth resulted from government spending, and how much from the market doing its job of allocating resources efficiently? (i.e., to those who will value them highly?)
Are poor people working more hours to get that consumption increase? Do they have more or less leisure and family time?
How economically secure are people? What is the typical person’s chance of falling into this bottom-20% consumption group? How has that changed?
I’ll try to address some of those questions in future posts.
Cross-posted at Asymptosis.

Very nice post.
Here’s a question, has some of the additional consumption resulted from an increased definition of necessities in a modern society?
Conservatives like to compare poverty to a standard of someone in say rural India or Africa but isn’t poverty, and to some extent inequality, determined against the society one lives in rather against a universal standard?
So in our current society people almost have to have a cell phone, the people I know that go without cell phones are actually fairly well off and have the means, substance, and circumstances to go without one. Many low level jobs require an individual to apply online so one needs a computer and internet access (and the skills and education to make use of them).
Poverty is a relative measure, relative to the society. The basic consumer infrastructure needed to be considered within the mainstream of society costs more than it did. Yes, cable television gives one a hundred channels, but cable is an expense each month and the fact that the hundred channels provide higher “value” is relatively meaningless.
Finally with respect to relativity, if a society promotes consumption as a primary psychological value doesn’t a certain level of poverty arise when the employment opportunities created in the society make it harder and harder for one to place oneself within the prevailing cultural goals.
I’ve probably said this quite badly but I think you’ve hit on something key with this post. I’ll be looking forward to the follow ups.
“Poor people today have air conditioners and smart phones!”
Yep, so somehow that means that, despite not seeing an increase in wages for decades, they(almost all Americans, not just the poor) are better off in this free market paradise. I think this thread is really valuable, and puts into numbers a thought I have had for a long time.
Let’s ad a big screen tv to the air conditioners and smart phones. Let’s say it costs $500 and lasts five years. Let’s say if it was made in the US it would cost $1000 and last five years.
So consumers are $500 better off. Course when you divide that by 60 months, that means they are $8.33 a month better off. Now, if that person works 40 hours a week and made 5 cents an hour he could buy the US TV and still be in the same place.
I would like to see all of the air conditioners, smart phones and tvs we buy put through this process. (Oh, wait, don’t forget the $150 sneakers).
What I believe it would result in is that the average American is being crucified on a cross of free trade.
oops
five cents MORE an hour
Steve:
Saw the lady driving a pink Cadillac the other day with a wad of welfare checks in her hand and stopping at a currency exchange to cash one of them.
The people making the charge are spewing forth nonsense.
The basic question is if the poor are consumjng more. In relation to their increased productivity they are definitely consuming less. You show that by comparing the output increase and stocks increasee to the increase in consumption.
In many ways the experience of being poor has not changeed much, but the experience of being rich is where you will find the greatest differences culturally, psychologically and physically.
@Mark:
Poverty measures are always based on some kind of threshold — how many above, how many below? Most based on some measure of income. Traditional relative thresholds usually 50% of median. US official measure is on pre-tax-and-transfer income. Recent supplemental measure includes T&T. I don’t think either includes cap gains, which are rare anyway among the poor. Relative measures work pretty well comparing similar countries — US vs Scandanavia. But the less similar the countries, the more it’s simply a comparison of inequality, not poverty. Absolute measures eg $10K US can tell you something, but even there you need to think about purchasing power parity. Does a dollar at the current echange rate buy the same number of potatoes in each compared country?
When conservatives show absolute poverty comparisons to, say, China, they’re basically saying to the American poor, “You’ve got clean running water. Stop whining.”
@EMichael:
Average bottom-20 household consuming about $4K/year more than in ’84. Imagine if they’d gone up with GDP/cap: $18K a year more than ’84, $14K more than current.
Would the whole country be more thriving and prosperous if 20 million poor households were each spending $48K a year? I’m saying yeah…
“Would the whole country be more thriving and prosperous if 20 million poor households were each spending $48K a year? I’m saying yeah…”
You get my vote!
Jim:
Good guess on the $income number. Jared Bernstein and James Linn did an article called “What We Need To Get By” October 2008. Briefly:
“On average nationwide, working families with two parents and two children require an income of $48,778 to meet the family budget. In major urban areas, expenses for this four-person family range from $42,106 in Oklahoma City to $71,913 in Nassau/Suffolk, N.Y.; families in small towns and rural areas start from a low of $35,733 in Marshall County, Miss. to $73,345 in Nantucket and Dukes Counties, Mass.”
If you ask people what they need to get by, they can pretty much tell you what the number is for them; but, is the number quoted by them the same as what is provided in programs. People also believe unemployment, food stamps, housing aid, Medicaid are far too generous and keep people from going back to work. It is interesting to see what people really believe it takes in income to get-by for themselves. According to one poll, 61% of those polled believe it takes from $30,000 to $75,000 just to get by for a family of 4 (2013). Of course, “getting by” is dependent upon where you live in the country. What plays in Montana will not make it in New Jersey where children coming from families with incomes in the eighties qualify for CHIPS insurance. The calculation for poverty is far below these limits and what programs provide would not make up the difference; but then, these people are speaking about what they need and not what the other guy needs.
More on this when I finish word-smithing my post.
run75441,
I think there may be some confusion here.
I was quoting from Steve Roth’s comment directly above mine.
And agreeing that we would be better off.
I actually read “research” stating that 97% of today’s poor have, in addition to TVs and cell phones, indoor toilets, so there! Not mentioning that pretty much everywhere, indoor toilets are the law for rentals or in towns, suburbs etc. (I really want to know where those other 3% are…)
One element to add to the poverty puzzle is the availability of shared resources like reliable transit, universal health care, public libraries, roads, broadcast media, public schools and so on.
Good reliable transit, for instance, can make it possible for a working person to get by without a car. A bus pass may cost $1000 a year, but it replaces a car, costing not less than $3000-7000 a year, to a net benefit of thousands per household per year. NOT because someone was taxed those thousands to give to the poor, but because the economies of scale were harnessed to their benefit. Why oh why are poor households forced to each maintain a vehicle, when good transit would free up all those $thousands for spending into the rest of the economy? Ditto health care and post secondary education.
It is not so much that Americans are poor, though that’s a thing, but that they are poor because their already low income is captured before it ever leaves the starting gate by unavoidable expenses.
One more thing — you can take as a general rule that, if an item shows up commonly in thrift shops, it no longer qualifies as a luxury. Laptops and scanners and printers and flat TVs started cropping up several years ago. Decent clothing has been there for decades. It would be interesting to track what % of bottom-quintile spending passes through charity shops, thrift stores, garage sales, and online classifieds.
Noni
Exogenous consumption is an increasingly severe problem in South Africa. As a developing country firmly in the grip of Globalization, there is undoubtedly a desire for both rich and poor to have the latest and most fashionable material objects available. This hunger has led to the above mentioned phenomenon of poor, often poverty-stricken, individuals possessing the latest smartphone or going out drinking on a regular basis. While some of this consumption can be linked to high crime rates in South Africa, their is a tendency for the lower class of South Africans to sacrifice their health and well-being for the sake of materialistic status and a relief from the stresses of life. How much of a part does media influence play in developed countries such as the United States? fascinating article for a South African economics student. Well Written.
@Noni: “I actually read “research” stating that 97% of today’s poor have, in addition to TVs and cell phones, indoor toilets, so there!”
Right. When conservatives go on about absolute poverty measures, they’re basically saying to the American poor, “You’ve got clean running water. Stop whining.”
@Fraser:
Thanks!
re: “relief from the stresses of life”
Have you read Karelis’s Persistence of Poverty? Really pardigm-changing, in my opinion. Whey poor people do what you describe, in a very real sense they’re being “rational” in response to their circumstances.
Are the poor better off today?
I would argue that in many ways, they are worse off than at any time since the Great Depression.
The newest reports reveal that today one in 5 American children go to bed hungry
See this HealthBeat post where a doctor reports that she treated an 8 year-old for months before realizing that his abdominal pain was, in fact, caused by hunger http://www.healthbeatblog.com/2011/05/when-poverty-and-unemployment-are-misdiagnosed-the-limits-of-medicine/#sthash.5gAE0FGE.dpuf
In 2013, 49.1 million Americans lived in food insecure households, including 33.3 million adults and 15.8 million children.
• In 2013, households with children reported food insecurity at a significantly higher rate than those without children, 20 percent compared to 12 percent.
• In 2013, households that had higher rates of food insecurity than the national average included households with children (20%), especially households with children headed by single women (34%) or single men (23%).
• In 2011, 4.8 million seniors (over age 60), or 8 percent of all seniors were food insecure.
• Food insecurity exists in every county in America, ranging from a low of 4 percent in Slope County, ND to a high of 33 percent in Humphreys County, Miss
In 2013, just 62 percent of food-insecure households participated in at least one of the three major federal food assistance programs –Supplemental Nutrition Assistance Program (SNAP-formerly Food Stamp Program), The National School Lunch Program (NSLP), and the Special Supplemental Nutrition Program for Women, Infants, and Children (WIC). http://feedingamerica.org/hunger-in-america/hunger-facts/hunger-and-poverty-statistics.aspx
Even among those who receive some govt, help, that help is not adequate.
The average monthly SNAP benefit per person is $133.85, or less than $1.50 per person, per meal.
In November Average SNAP (formerly food stamp) benefits were cut by about 7 percent
Most SNAP recipients already had difficulty affording food, and the lost benefits equal about ten meals a month for an average SNAP household.
http://www.offthechartsblog.org/snap-benefit-cut-has-worsened-hardships-for-low-
Fox News and the Heritage Foundation like to point out that today, the poor have air-conditioning, cell phones, TVs, internet access and computers. Here are the facts:
Air-Conditioning
80 percent of American homes have air-conditioning. 20 percent don’t.
Unfortunately those 20% are not all in Alaska. That’s why 74 people (including a 4-month old girl) died in the 2012 heat wave that sent temperatures about 100 degrees from the Midwest to the East Coast. http://usnews.nbcnews.com/_news/2012/07/08/12624445-us-heat-wave-eases-but-death-toll-rises?lite
MSN reports that hundreds of people in the United States die from heat-related illnesses each year.
Finally, among the 20% that have AC, many cannot afford to use it.
Air-conditioning in schools In New York (where school doesn’t end until June 26): Roughly a third of public school classrooms lack AC Almost all are in poor neighborhoods. “In other major cities, especially in poorer districts, the figures are comparable or worse” . . . “Cool schools are critical if we are to boost achievement. Studies show that concentration and cognitive abilities decline substantially after a room reaches 77 or 78 degrees. This is a lesson American businesses learned long ago.” http://opinionator.blogs.nytimes.com/2013/06/01/schools-are-not-cool/
Internet Access, computers, TVs
–Nearly two-thirds of the poor have cable or satellite TV.
— Half have a personal computer,
.
— 43 percent have Internet access
For the half that don’t have a computer, or Internet Access, many things are difficult including doing homework, and finding out how to apply for healthcare under the Affordable Care Act
The problem with measuring standards of living in terms of gadgets tells us little about standards of living. The folks at Fox News who talk about how much the Poor have and consume have tend to ignore:
What Today’s Poor Don’t Have
Affordable, safe day care (In the past, when families lived closer together, relatives could take care of children, and baby-sitters were far less expensive. And of course, until we “reformed” welfare in the 1990s, poor mothers could stay at home and care for their mother. Today, poor mothers are forced to take minimum wage jobs–and worry about their kids.
Medical Care–If a poor family lives in a state that hasn’t expanded Medicaid ,sick children go untreated. There was a time (in the 1950s and 1960s) when doctors came to the home when a child was stick, told poor families “Just pay me whatever you can”—and accepted a dollar or two, or maybe just a pie or a cake.
A defined benefit pension (which, back in the 1970s, many low-paid factory workers had). Jobs (for the poor, the recovery has not brought back the jobs they had before the Great Recession), and unions no longer protect jobs.
Decent public school education for their children. (In places like NYC, as in many other towns and cities, public school teachers were respected, better-trained and in some cases better-paid. (In the 40s, 50 and 60s a teacher was paid significantly less than other professionals, in part because she was a woman, but the gap between teachers’ salaries and salaries of other professionals was not nearly as wide as it is today.
As a result, the profession attracted some of the brightest young women graduating from our colleges.
Today, teaching is not a first choice for most “A” students, and many teachers in poor neighborhoods are either inexperienced “Teach for America” 21-year-olds, or “burned out” 50 year olds waiting for retirement. Poor parents have to worry about whether their children will learn to read.
— Police Protection. Corruption has lowered standards on many of our police forces. In addition, in the past, most police-men working in cities like N.Y. had military training. As a veteran NYC officer told me a couple of years ago. “They were disciplined, brave, and in good shape. They knew they could take care of themselves and were much less likely to shoot kids.”
Now, many more policemen have college degrees, but 80% are overweight http://www.medicaldaily.com/80-police-officers-are-overweight-why-theyre-more-likely-die-heart-disease-fighting-crime-298336 and not at all confident that they can defend themselves. They’re scared. This presents dangers for everyone.
Poor parents have to worry that their teen-ager will become a target, or that their 6-year-old will be hit by cross-fire.