Housing: Construction Spending Up, Sales Down
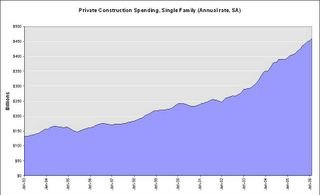
The Census Bureau reported a sharp rise in U.S. construction spending in February led by private residential construction spending. Private residential spending increased to a record $665.7 Billion in February (SA, annual rate), 1.3% above the revised January estimate.
The first graph shows private U.S. construction spending for single family homes since 1993. All numbers are annual rates and seasonally adjusted.

Click on graphs for larger images.
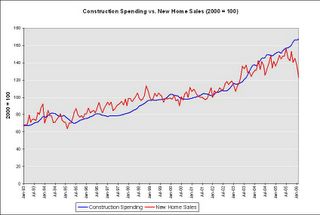
But aren’t sales falling? The second graph shows single family construction spending, adjusted for inflation, compared to New Home Sales. The year 2000 = 100 for both series.
This shows the divergence of construction spending and New Home Sales over the last few months. Although the data series for construction spending is only available back to 1993, we can also look at construction employment vs. New Home Sales for historical patterns. In previous slowdowns, construction employment also kept rising for six months to a year after the peak of the housing cycle (see New Homes Sales vs. Construction Employment)
So this is a common occurrence in the early stages of a housing slowdown; homebuilders just keep on building. Maybe homebuilders believe sales will bounce back. Or maybe builders are rushing projects to completion. But the result is predictable if the sales slowdown continues: more inventory, and probably price pressures with some speculative builders possibly in financial distress next year.
Best Regards, CR Calculated Risk

