Will Boston Lead the Housing Bust?
Writing in the Lowell Sun, Dan O’Brien reports that a number of towns in Middlesex County are reporting year-over-year median price declines. O’Brien provides details for Dracut and Lowell, and then writes:
Other Middlesex County communities showing year-over-year price drops (among those with at least 20 sales) include Arlington, Hopkinton, Hudson, Lexington, Natick, Newton, Reading and Weston.
…we haven’t seen year-over-year declines in a long time. Throw in higher interest rates — the average 30-year mortgage rate was 6.31 percent this past week, still historically low, but the highest in four years. Then add record inventories, sluggish job growth (and with it, almost non-existent wage growth) and higher energy prices.
…
Does this mean the sky is falling? That prices are set to plunge like in the early ’90s? No. But there comes a point where prices simply outrun the income levels of new buyers, no matter how exotic the lending gets.In Massachusetts, we appear to be there.
So the message is clear: This market is getting tired.
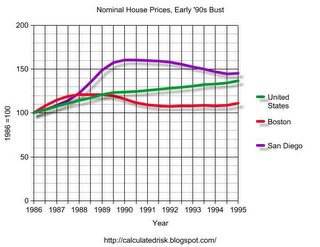
In the early ’90s, the Boston area was the first boom area with declining prices. Nominal house prices peaked in Boston in late 1989, about one year earlier than San Diego. The following graph shows nominal prices in Boston, San Diego and US in the early ’90s. (Dec, 1986 = 100)

Click on graph for larger image.
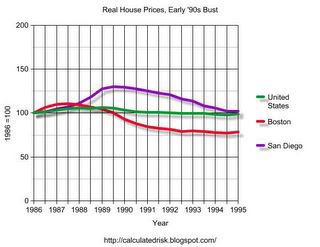
In real terms, in the early ’90s, Boston led the US and San Diego price declines by about one year.
The Boston area has substantially more inventory than most of the country. In July, the supply of existing homes reached 8.8 months in Massachusetts. Nationwide existing home supplies are about 4.7 months, so its no surprise that Boston is one of the first bubble areas to see house price declines.
Best Regards, CR Calculated Risk

