Last week I wrote a synopsis of the short leading indicators and what they suggested about the ultimate Presidential election result in November. Basically, they have improved over the last several months and suggested the polls would tighten compared with the present.
Among the missing June indicators were durable goods. They were reported this morning, and continued their sharp rebound from May, making up in total about half of their pandemic decline:
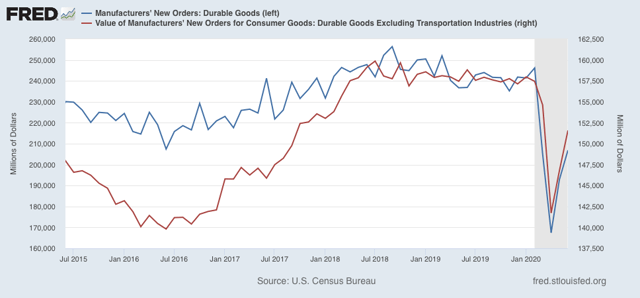
This adds to the evidence that the economy is likely to be better in November than it was in Q2, so adds incrementally to the idea that the race will tighten somewhat compared with recent polls.
What happens when it reverses in August -October period?? This graph is meaningless.
unfilled orders for durable goods are a better measure of industry conditions than volatile new orders, & they fell for the 3rd time in four months, decreasing by $15.4 billion or 1.4 percent to $1,092.4 billion, following a statistically insignificant May increase to $1,107.84 billion, which was revised down from the 0.1% increase to $1,108.6 billion reported last month….compared to a year ago, the unfilled order book for durable goods was 4,8% below the level of last June, with unfilled orders for transportation equipment 6.8% below their year ago level, reflecting the impact of a 12.2% decrease in the backlog of orders for commercial aircraft…