Factors Contributing to U.S. Healthcare Spend
Briefly, just a quick and simple look as what contributes to total US healthcare spending. This is part of a much larger report: “How Has U.S. Health Care Spending Changed Over Time?” I find this part of the report to be interesting. But then, I was a consultant who was looking at throughput analysis.
Very much like Lean Six Sigma, the breakdown gives us a direction as to where to look in terms of finding a solution. That is if one solution can be found. There may be impediments to resolving cost issues. In any case, it is a direction and we can break it down into what elements are the cost factors.
~~~~~~~
What Factors Contribute to U.S. Health Care Spending?
Over the last several decades, health spending has been driven higher by a number of factors, including but not limited to an aging population, rising rates of chronic conditions, advancements in medicine and new technologies, higher prices, and expansions of health insurance coverage. While there are always differences across countries, many of these factors driving health costs upward in the U.S. are also driving health costs growth in peer nations.
- For example, while the U.S. population is indeed aging and that is driving health costs up, many large and wealthy nations have even more rapidly aging populations.
Other factors may explain the United States’ relatively high health spending compared to its peers.
- The U.S. health system is fragmented, with many private and public payers, and with regulation of these payers split between states and the federal government. However, these features are not entirely unique to the U.S., either. Indeed, some other countries with much lower health spending have multiple private payers or differences in public programs across states or provinces. The U.S. is also not alone in having a mainly fee-for-service payment system.
- The U.S. health insurance system is largely voluntary, whereas peer countries’ health systems are almost entirely compulsory.
- Additionally, the U.S. federal and state governments have generally done less to directly regulate or negotiate prices paid for medical services or prescription drugs than have governments of similarly large and wealthy nations. The U.S. often pays higher prices for the same brand ame prescription drugs, hospital procedures, and physician care than similarly large and wealthy countries do.
Factors, largely outside the control of the health system that are also likely at play.
- Socioeconomic conditions (like income inequality and other social determinants of health), and differences in so-called lifestyle factors (like diet, drug use, or physical activity) that could contribute both to higher spending and worse outcomes.
Breaking total national health spending into its components can reveal the major drivers of health costs and where cost containment efforts could be most effective. The charts below show various ways of examining the key contributors to health spending.
The National Health Expenditure Accounts show trends in how health spending varies by type of service (e.g., hospital care vs. retail prescription drugs) or by source of funds (e.g., private health plans vs. public programs). An alternative and relatively new approach to understanding health spending is to break out total health spending into the share that goes to treat certain diseases (e.g., heart disease, cancer).
Finally, health spending can also be better understood by looking at trends in prices (e.g., the dollar amount for a hospital stay) and utilization (e.g., the number of hospital stays).
Hospital and Physician Services Represent Half of Total Health Spending
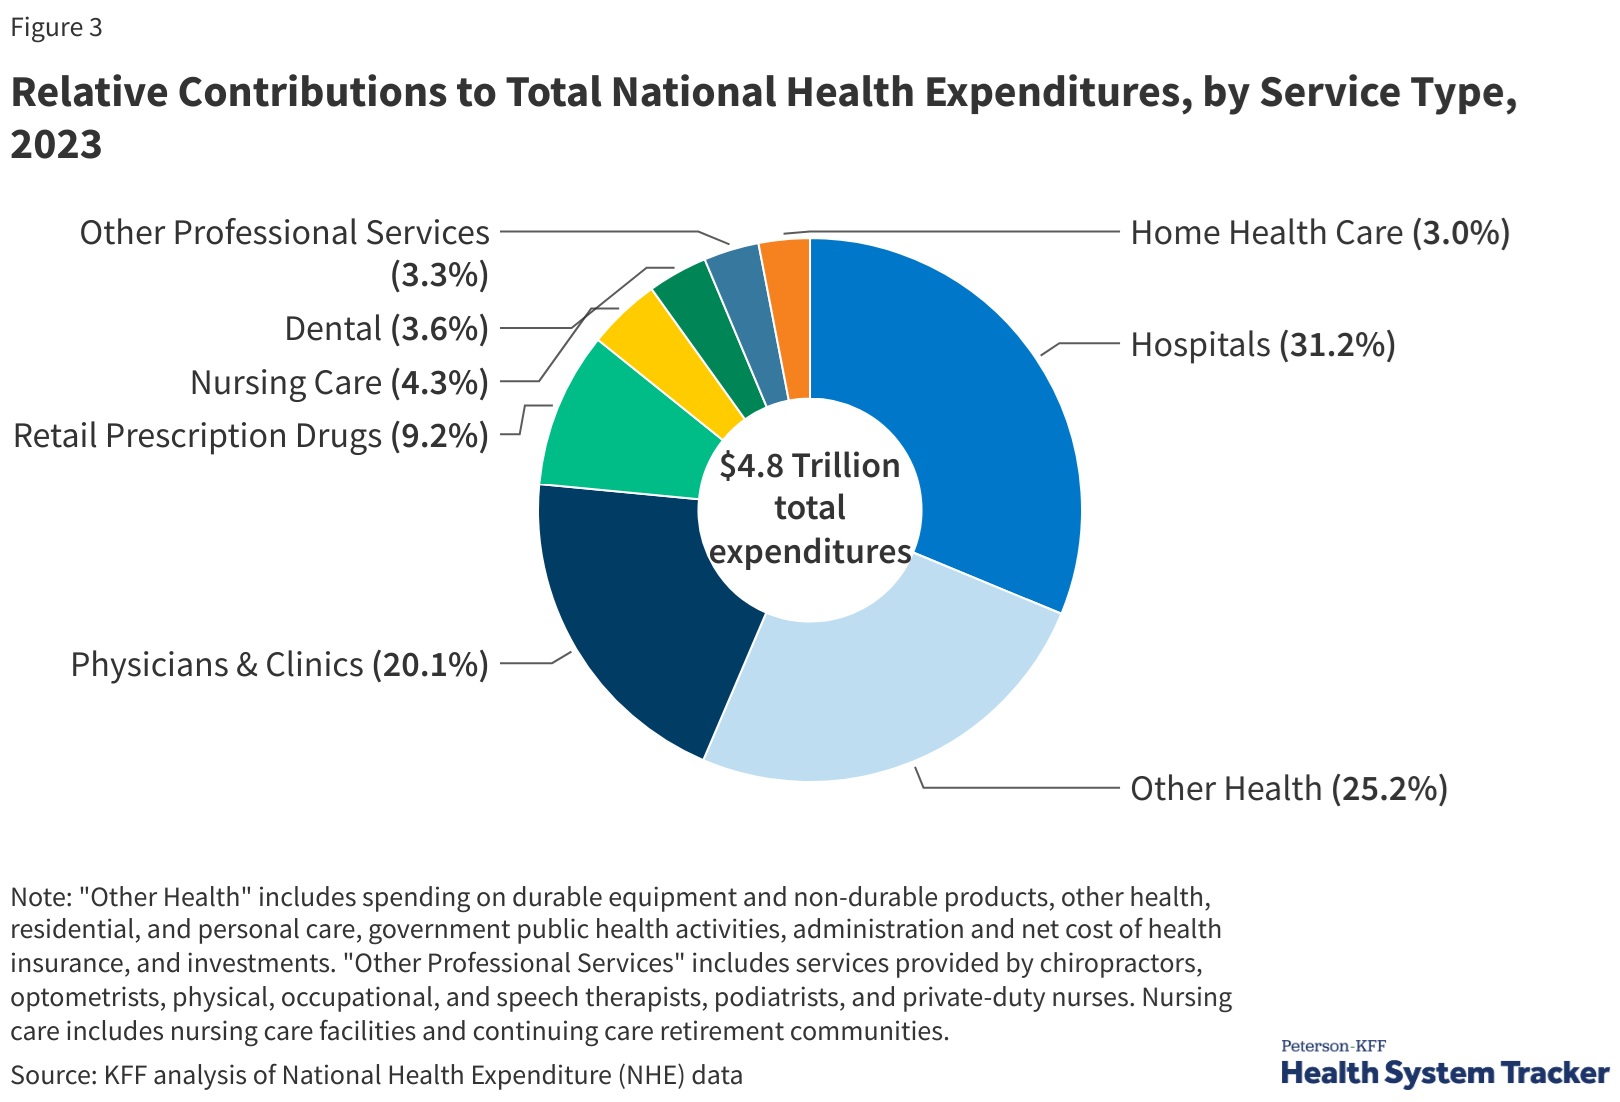
Most health spending in the U.S. and in peer countries is on hospital and physician care, followed by prescription drugs.
- In the U.S., hospital spending represented close to a third (31.2%) of overall health spending in 2023, and.
- Physicians/clinics represented 20.1% of total spending.
In comparison to other large and wealthy countries, the U.S.’s higher spending on inpatient and out-patient care explains the vast majority of higher spending on health care overall.
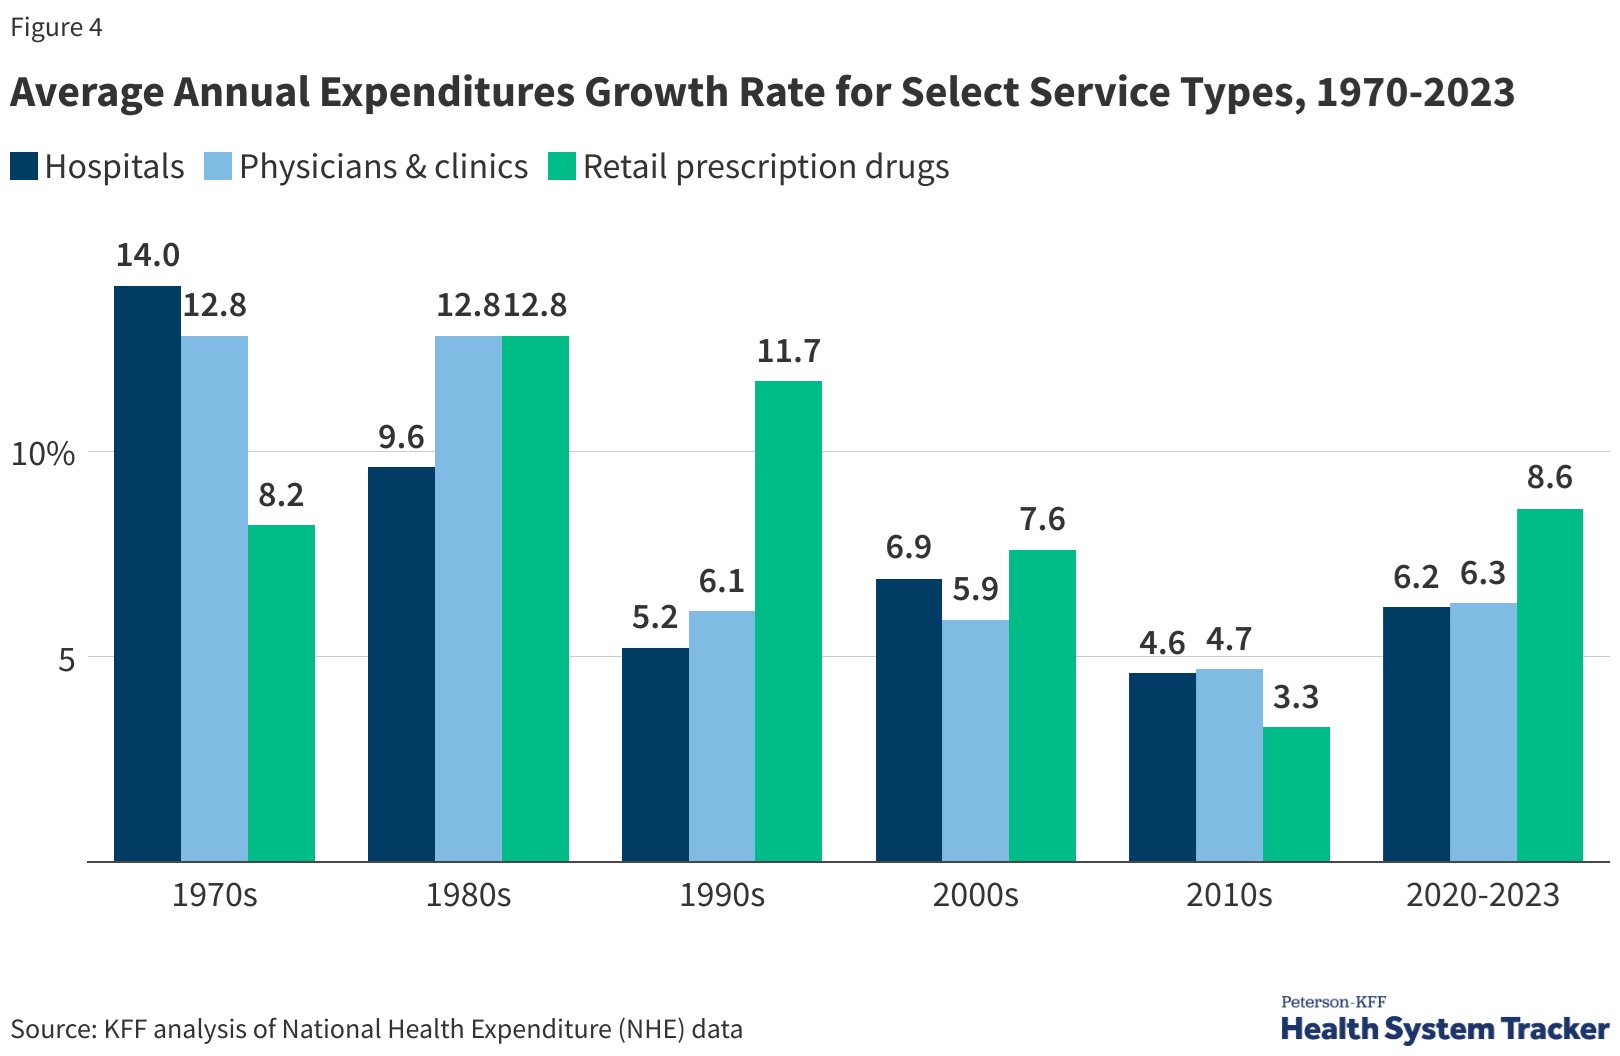
During the 1970s, growth in hospital expenditures outpaced other services. Prescriptions, physician fees, and clinic services experienced faster spending growth during the 1980s and 1990s.
- From 2020 to 2023, retail prescription drugs experienced the fastest growth in spending at 8.6%, following 3.3% average annual growth from 2010 to 2020.
- Average spending growth for hospitals and physicians/clinics between 2020 and 2022 was 6.2% and 6.3%, respectively.
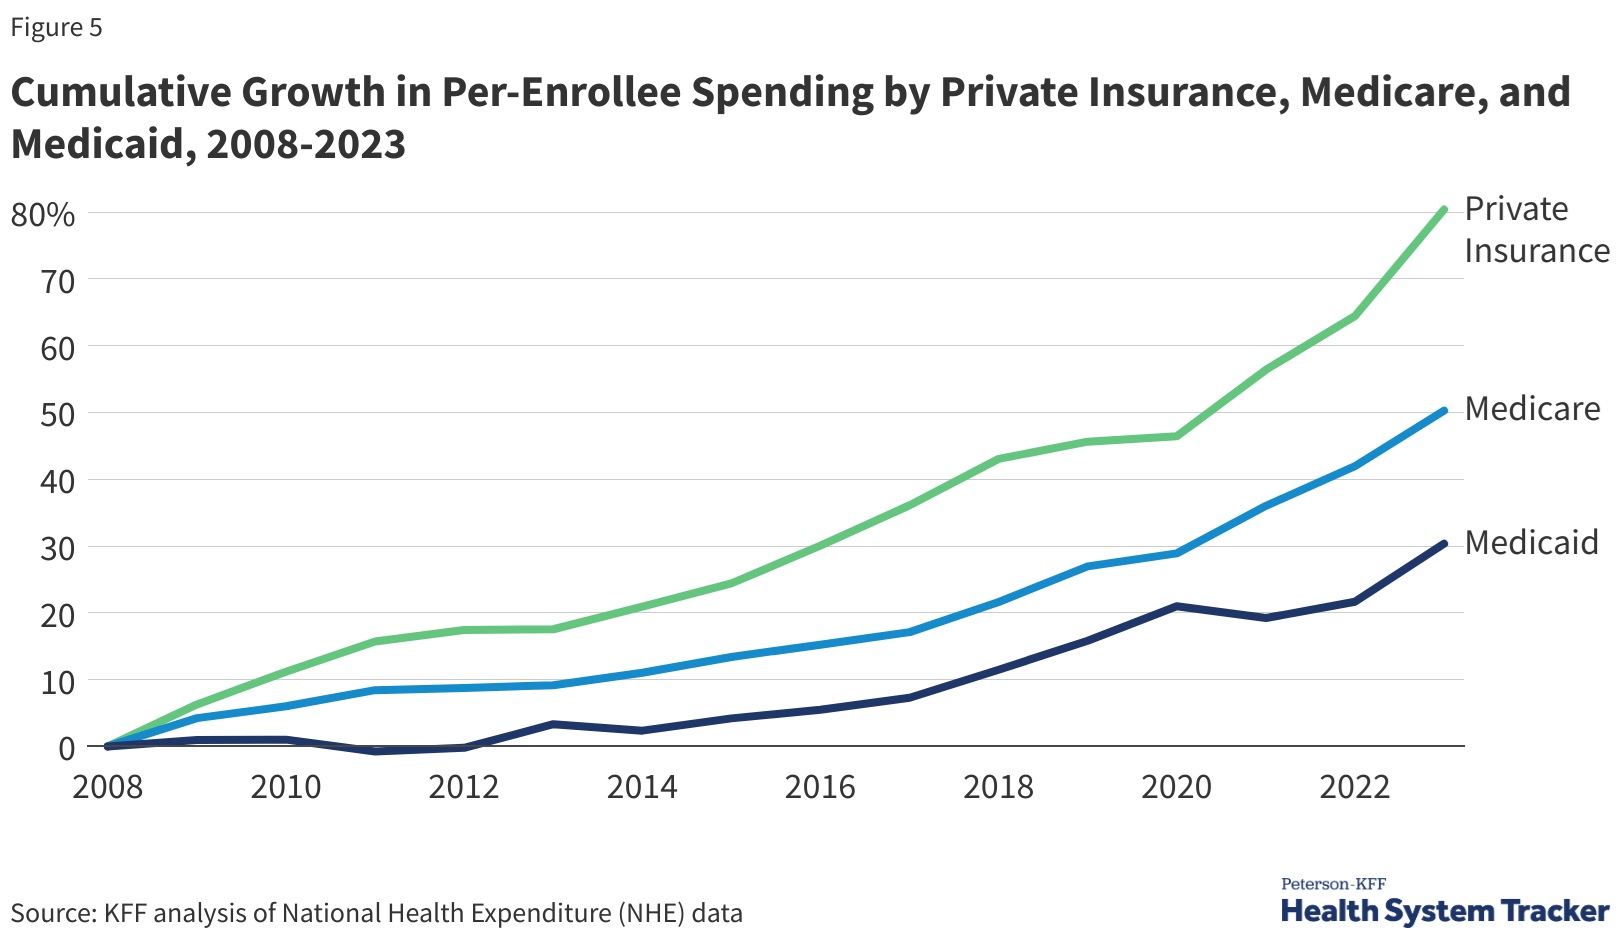
Per enrollee spending by private insurance grew by 80.4% from 2008 to 2023. This was much faster than both Medicare and Medicaid spending growth per enrollee (50.3% and 30.3%, respectively). Also, private insurance often pays higher prices for health care compared to prices paid by Medicare and Medicaid.
~~~~~~~
The rest of the Kaiser Report reviews what percentage of cost by Medical Condition. For example, 15% of cost are on Ill-defined conditions (15.1%). Another ~10% is on Circulatory conditions. Together they make up 25% of costs expenditures in 2021 as the pie chart shows in Figure 6, “Distribution of Total Medical Services Expenditures, by Medical Condition, 2021,”
Per enrollee spending by Medicaid rose by 7.9% in 2023 from the previous year, and also continued to increase in private insurance and Medicare (5.9% and 7.1% respectively). Medicare and private insurance per-enrollee spending continued to grow faster between 2021 and 2023 after slower growth in 2020. Medicaid per-enrollee spending had previously declined in 2021 as total enrollment grew, particularly among children and non-elderly adults, who generally have lower per-enrollee spending.
“How Has U.S. Health Care Spending Changed Over Time? – Health Care Costs and Affordability,” KFF and “Health Care Costs and Affordability,” KFF