Did the Baby Boom Labor Force Surge Cause The Great Inflation?
Steve Randy Waldman delivers another Aha! post (and a followup reply to Scott Sumner) pointing out a huge driver of the 1970s Great Inflation — the rise in the labor force:
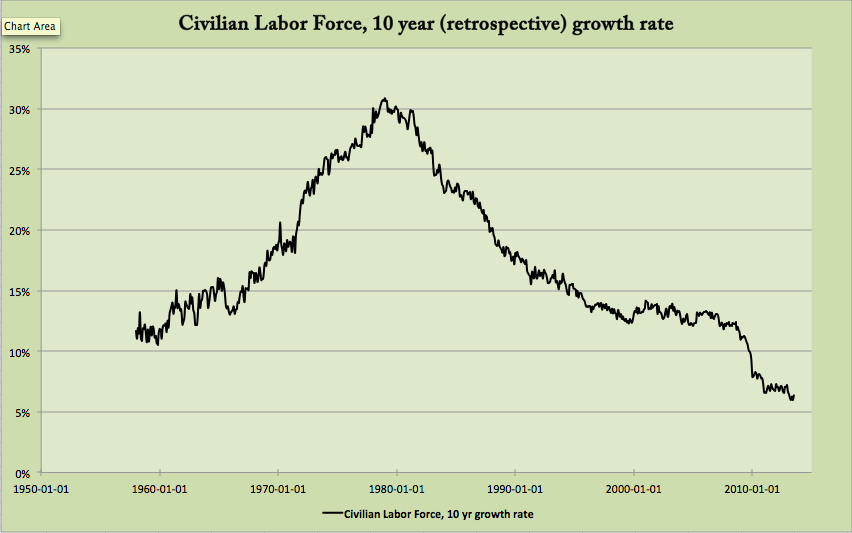
Between the mid 60s and the mid 70s, the labor force grew by 30%.*
Steve, emphasis mine:
The root cause of the high-misery-index 1970s was demographics, plain and simple. The deep capital stock of the economy — including fixed capital, organizational capital, and what Arnold Kling describes as “patterns of sustainable specialization and trade” — was simply unprepared for the firehose of new workers. The nation faced a simple choice: employ them, and accept a lower rate of production per worker, or insist on continued productivity growth and tolerate high unemployment.
Capitalists didn’t have the capacity to justify employing all those workers at the prevailing wage. The only way to employ them was to lower real wages (always sticky in real terms) via inflation. The Fed accommodated that, favoring employment over wage control. The alternative would have been massive unemployment of all those eager up-and-coming boomers. Would that have been A Good Thing?
I’ve been worrying at the various Great-Inflation explanations for a decade, and I’ve never found them satisfying. Some seeming errors and contortions of economic logic aside, the imputed causes (OPEC?) have just never seemed big enough to bring about the massive economic effects we encountered.
This definitely does. Steve has added a (maybe the) crucial piece that allows me to understand this period.
Do monetarists really want to argue that the “stag” part of stagflation (unemployment) would have been the same if the Fed had gone Volcker in 1975? They were facing a tradeoff driven by a massive demographic shift. Incorporate that shift in your thinking, and you can ask the important question: would excluding those new workers (“financial repression!”) have been worth it, in return for lower inflation? (Inflation that eviscerated the real buying power share of financial-capital holders and creditors.)
You can argue about the answer, but this is sure: the rise in the labor force that Steve points out is crucial to thinking about The Great Inflation, and it’s been completely absent from the mainstream-storyline Great-Inflation explanations that I’ve wrestled with over the years. Viz two epitomes of that mainstream here and here. Neither one even mentions the labor force.
* This also of course involving what is perhaps the single largest macroeconomic shift from the 60s to the turn of the millenium: women entering the work force:
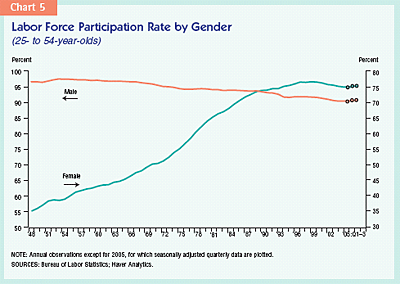
Over the 60 years following WWII, women’s labor-force participation jumped from 35% to 75%. In the 70s alone it jumped from 50% to 65%.
Cross-posted at Asymptosis.
“You can argue about the answer, but this is sure: the rise in the labor force that Steve points out is crucial to thinking about The Great Inflation, and it’s been completely absent from the mainstream-storyline Great-Inflation explanations that I’ve wrestled with over the years.”
Really?!?
Katz and Krueger, 1999, Page 32:
“A venerable macroeconomic tradition examines the extent to which changes in the age and sex composition of the labor force can explain secular movements in the unemployment rate. The much higher unemployment rates for teenagers and young adults than for adults of prime working age make it plausible that changes in the age structure of the work force can substantially affect the unemployment rate. Seminal studies by George Perry and by Robert Gordon provide strong evidence that changes in the age and sex composition of the work force (the labor market entry of the baby-boom cohorts and a rapid expansion of female labor force participation) contributed to an increase in the NAIRU in the 1960s and 1970s.39 The convergence in male and female unemployment rates since the early 1980s indicates that the direct effect of sex-composition changes on the unemployment rate is unlikely to have been important over the past two decades. But recent studies by Robert Shimer and by Robert Horn and Phillip Heap suggest that age-structure changes driven by the maturing of the baby-boom cohorts can account for a substantial part of the lower unemployment in the 1990s than in the 1970s and 1980s.40 In this section we reassess the role of age-structure changes and explore the possible consequences for the NAIRU of continuing secular increases in the educational attainment of the adult work force.”
http://www.brookings.edu/~/media/Projects/BPEA/Spring%201999/1999a_bpea_katz.PDF
Ball and Mankiw, 2002, Page 125:
“The most obvious reason the labor force changes is demographics. In seeking to explain the evolution of the NAIRU, a number of authors point to a particular type of shift: the changing age structure as the baby boom generation has moved through the labor force. The proportion of the labor force aged 16 –24 rose from 17 percent in 1960 to 24 percent in 1978 as the baby boomers entered the labor force as young workers, and this percentage fell to 16 percent in 2000 as the boomers have aged. These trends are potentially important because young workers have higher unemployment rates than older workers: over 1960–2000, the average unemployment rate was 12.2 percent for workers 16–24 and 4.4 percent for workers 251. Gordon (1998) has argued that the increase in young workers accounts for much of the increase in the NAIRU before 1980, and Shimer (1999) argues that the recent decrease explains much of the NAIRU fall.
The classic method for measuring the effects of demographic changes is to compute a “Perry-weighted” unemployment rate (Perry, 1970; Katz and Krueger, 1999). This is a weighted average of unemployment rates for different demographic groups with fixed weights; by contrast, the usual aggregate unemployment rate has weights equal to labor-force shares, which change over time. A time series for Perry-weighted unemployment shows what would have happened to the unemployment rate given the evolution of each group’s unemployment if the sizes of groups did not change.”
http://scholar.harvard.edu/files/mankiw/files/jep.ballmankiw.pdf
Changing Labor Markets and Inflation
George L. Perry
1970
[No Abstract]
http://www.brookings.edu/about/projects/bpea/editions/~/media/Projects/BPEA/1970%203/1970c_bpea_perry_schultze_solow_gordon.PDF
Inflation, Flexible Exchange Rates, and the Natural Rate of Unemployment
Robert J. Gordon
December 1982
Abstract:
“The most important conclusion of this paper is that the growth rate of the money supply influences the U.S. inflation rate more strongly and promptly than in most previous studies, because the flexible exchange rate system has introduced an additional channel of monetary impact, over and above the traditional channel operating through labor-market tightness. Lagged changes in the effective exchange rate of the dollar, through their influence on the prices of exports and import substitutes, help to explain why U.S. inflation was so low in 1976 and why it accelerated so rapidly in 1978. Granger causality tests indicate that lagged exchange rate changes influence inflation, but lagged inflation does not cause exchange rate changes. A policy of monetary restriction in the 1980s is shown to cut the inflation rate by five percentage points at about half the cost in lost output as compared with the consensus view from previous studies. The paper defines the “no shock natural rate of unemployment” as the unemployment rate consistent with a constant rate of inflation in a hypothetical state having no supply shocks and a constant exchange rate. A new estimate of this natural rate concept displays an increase from 5.1 percent in 1954 to 5.9 percent in 1980 that is entirely due to the much-discussed demographic shift in labor-force shares and relative unemployment rates. Other higher estimates of the natural unemployment rate, close to 7 percent in 1980, result from the use of a naive Phillips curve that relates inflation only to labor-market tightness and inertia variables. The paper contains extensive sensitivity tests that examine the behavior of the basic inflation equation over alternative sample periods; that enter the growth rate of money directly and track the behavior of a money- augmented equation in dynamic simulation experiments; and that test and reject the view that wage-setting behavior is dominated by “wage-wage inertia”, that is, the dependence of wage changes mainly on their own past values.”
Link for Robert Gordon paper:
http://www.nber.org/papers/w708
The problem with the idea that demographics or lackluster productivity growth is driving NGDP growth is that NGDP growth was nearly universally too fast in the advanced world in the late 1960s through the early 1980s and yet not every country was undergoing a boom in labor force growth or suffering from slow productivity growth.
The following annual data comes from AMECO (NGDP from 1960), the OECD (civilian labor force from 1955/1956) and the Conference Board (RGDP from 1950).
Here are some counterexamples.
1) West Germany
Peak NGDP growth is 141.1% in 1967-77 when civilian labor force growth was 2.4%. Peak civilian labor force growth is 10.4% in 1980-90 when NGDP growth was 65.7%.
2) UK
Peak NGDP growth is 344.4% in 1971-81 when civilian labor force growth was 6.2%. Peak civilian labor force growth is 10.0% in 1998-2008 when NGDP growth was 63.2%.
3) Spain
Peak NGDP growth is 476.7% in 1970-80 when civilian labor force growth was 5.4%. Peak civilian labor force growth is 33.7% in 1997-2007 when NGDP growth was 109.1%.
4) Netherlands
Peak NGDP growth is 224.6% in 1966-76 when civilian labor force growth was 8.3%. Peak civilian labor force growth is 19.8% in 1992-2002 when NGDP growth was 73.4%.
5) Sweden
Peak NGDP growth is 210.9% in 1973-83 when civilian labor force growth was 10.5%. Peak civilian labor force growth is 13.0% in 2002-12 when NGDP growth was 45.5%.
6) Austria
Peak NGDP growth is 180.5% in 1967-77 when civilian labor force growth was (-3.2%). Peak civilian labor force growth is 15.4% in 1985-95 when NGDP growth was 69.3%.
7) Ireland
Peak NGDP growth is 513.8% in 1971-81 when civilian labor force growth was 12.2%. Peak civilian labor force growth is 46.1% in 1997-2007 when NGDP growth was 176.9%.
8) Luxembourg
Peak NGDP growth is 179.6% in 1964-74 when civilian labor force growth was 17.0%. Peak civilian labor force growth is 48.1% in 1998-2008 when NGDP growth was 114.6%.
Furthermore several of these nations had significantly higher productivity growth (RGDP per labor force member) when NGDP growth was at peak than when civilian labor force growth was at peak. West Germany, Spain, the Netherlands and Austria had productivity growth of 40.6%, 52.8%, 43.8%, 63.1% respectively during the decades when NGDP growth was at peak, and productivity growth of 10.6%, 10.2%, 12.9%, 13.1% respectively during the decades when civilian labor force growth was at peak.
Was there a depression in any of these countries when civilian labor force growth hit its peak despite the much slower rates of growth in NGDP? In particular was there a depression in those countries where productivity growth was also much slower?
West Germany, Spain, the Netherlands and Austria had unemployment rates of 5.0%, 8.3%, 3.1% and 3.9% respectively in 1990, 2007, 2002 and 1995 respectively. (These are harmonized unemployment rates with the exception of West Germany.) West Germany’s rate was not a record for the post-WW II period but it was higher than it had been prior to 1982. Spain’s unemployment rate was the lowest since 1979, nearly 30 years previously. The Netherland’s unemployment rate was lowest ever except for the previous year (2.6%) on records extending back to 1983. Austria’s unemployment rate has only been lower three times since then and never lower than 3.6%.
“Capitalists didn’t have the capacity to justify employing all those workers at the prevailing wage. The only way to employ them was to lower real wages (always sticky in real terms) via inflation. The Fed accommodated that, favoring employment over wage control. The alternative would have been massive unemployment of all those eager up-and-coming boomers. Would that have been A Good Thing?”
Ah, but your forgetting about the real problem in that very correct answer: productivity. The workers productivity dropped and crime began to surge in that period. While the Boomer’s labor force did drive inflation, it was the productivity slump that “really” caused the problems compared to the 45-65 timeframe. The question is were the boomers lazier or was there something else, a “poison” such as lead causing worker illness? If Productivity had been higher, the capacity for those wage increases become reality and the great inflation never happens.
We have the opposite problem today. The low wages are not attracting women to the labor force so they stay home with the kids and live off of what their Husband makes, family gives and government assistance. Basically we have been to productive and need wages to rise to meet demand. We are starting to see tight labor markets in some areas of the economy right now, with a little blip up in all wage groups as a sign of this “incoming” problem.
Hence, people need not whine about the “fall” in LFPR, it is quite understandable.
@Mark Sadowski
Steve answered this in his second post:
“I don’t claim that always and everywhere population booms must coincide with productivity collapses — sometimes population booms coincide (usually not coincidentally!) with opportunities for expanded production. I don’t claim that all monetary expansions derive from attempts to employ a burgeoning population. (Sometimes they are about exchange rates, for example!)”
@John Cummings:
I’m pretty much with you all the way on that, though I don’t find the last sentence useful.
@Mark Sadowski:
I also note that none of the 70s labor force growth numbers you cite are even in the same ballpark as US 30% growth in the 70s. Comparable situations? Combinations of factors….
“I also note that none of the 70s labor force growth numbers you cite are even in the same ballpark as US 30% growth in the 70s. Comparable situations? Combinations of factors…. ”
Peak civilian labor force growth in the US is 30.1% in 1969-79.
Peak civilian labor force growth in Spain is 33.7% in 1997-2007, peak civilian labor force growth in the Netherlands is 19.8% in 1992-2002, peak civilian labor force growth in Austria 15.4% in 1985-95, peak civilian labor force growth in Ireland is 46.1% in 1997-2007, Peak civilian labor force growth in Luxembourg is 48.1% in 1998-2008.
What definition of “ballpark” are you using?
P.S. My first comment (the one that quotes you) appears to be held in moderation. Can you please release it?
Oh well. Here’s my first comment without links.
Steve Roth:
“You can argue about the answer, but this is sure: the rise in the labor force that Steve points out is crucial to thinking about The Great Inflation, and it’s been completely absent from the mainstream-storyline Great-Inflation explanations that I’ve wrestled with over the years.”
Really?!?
Katz and Krueger, 1999, Page 32:
“A venerable macroeconomic tradition examines the extent to which changes in the age and sex composition of the labor force can explain secular movements in the unemployment rate. The much higher unemployment rates for teenagers and young adults than for adults of prime working age make it plausible that changes in the age structure of the work force can substantially affect the unemployment rate. Seminal studies by George Perry and by Robert Gordon provide strong evidence that changes in the age and sex composition of the work force (the labor market entry of the baby-boom cohorts and a rapid expansion of female labor force participation) contributed to an increase in the NAIRU in the 1960s and 1970s.39 The convergence in male and female unemployment rates since the early 1980s indicates that the direct effect of sex-composition changes on the unemployment rate is unlikely to have been important over the past two decades. But recent studies by Robert Shimer and by Robert Horn and Phillip Heap suggest that age-structure changes driven by the maturing of the baby-boom cohorts can account for a substantial part of the lower unemployment in the 1990s than in the 1970s and 1980s.40 In this section we reassess the role of age-structure changes and explore the possible consequences for the NAIRU of continuing secular increases in the educational attainment of the adult work force.”
Ball and Mankiw, 2002, Page 125:
“The most obvious reason the labor force changes is demographics. In seeking to explain the evolution of the NAIRU, a number of authors point to a particular type of shift: the changing age structure as the baby boom generation has moved through the labor force. The proportion of the labor force aged 16 –24 rose from 17 percent in 1960 to 24 percent in 1978 as the baby boomers entered the labor force as young workers, and this percentage fell to 16 percent in 2000 as the boomers have aged. These trends are potentially important because young workers have higher unemployment rates than older workers: over 1960–2000, the average unemployment rate was 12.2 percent for workers 16–24 and 4.4 percent for workers 251. Gordon (1998) has argued that the increase in young workers accounts for much of the increase in the NAIRU before 1980, and Shimer (1999) argues that the recent decrease explains much of the NAIRU fall.
The classic method for measuring the effects of demographic changes is to compute a “Perry-weighted” unemployment rate (Perry, 1970; Katz and Krueger, 1999). This is a weighted average of unemployment rates for different demographic groups with fixed weights; by contrast, the usual aggregate unemployment rate has weights equal to labor-force shares, which change over time. A time series for Perry-weighted unemployment shows what would have happened to the unemployment rate given the evolution of each group’s unemployment if the sizes of groups did not change.”
Changing Labor Markets and Inflation
George L. Perry
1970
[No Abstract]
Inflation, Flexible Exchange Rates, and the Natural Rate of Unemployment
Robert J. Gordon
December 1982
Abstract:
“The most important conclusion of this paper is that the growth rate of the money supply influences the U.S. inflation rate more strongly and promptly than in most previous studies, because the flexible exchange rate system has introduced an additional channel of monetary impact, over and above the traditional channel operating through labor-market tightness. Lagged changes in the effective exchange rate of the dollar, through their influence on the prices of exports and import substitutes, help to explain why U.S. inflation was so low in 1976 and why it accelerated so rapidly in 1978. Granger causality tests indicate that lagged exchange rate changes influence inflation, but lagged inflation does not cause exchange rate changes. A policy of monetary restriction in the 1980s is shown to cut the inflation rate by five percentage points at about half the cost in lost output as compared with the consensus view from previous studies. The paper defines the “no shock natural rate of unemployment” as the unemployment rate consistent with a constant rate of inflation in a hypothetical state having no supply shocks and a constant exchange rate. A new estimate of this natural rate concept displays an increase from 5.1 percent in 1954 to 5.9 percent in 1980 that is entirely due to the much-discussed demographic shift in labor-force shares and relative unemployment rates. Other higher estimates of the natural unemployment rate, close to 7 percent in 1980, result from the use of a naive Phillips curve that relates inflation only to labor-market tightness and inertia variables. The paper contains extensive sensitivity tests that examine the behavior of the basic inflation equation over alternative sample periods; that enter the growth rate of money directly and track the behavior of a money- augmented equation in dynamic simulation experiments; and that test and reject the view that wage-setting behavior is dominated by “wage-wage inertia”, that is, the dependence of wage changes mainly on their own past values.”