2nd Look at Local Housing Markets in September
– by Bill McBride
Calculated Risk
NOTE: The tables for active listings, new listings and closed sales all include a comparison to September 2019 for each local market (some 2019 data is not available).
This is the second look at several early reporting local markets in September. I’m tracking over 40 local housing markets in the US. Some of the 40 markets are states, and some are metropolitan areas. I’ll update these tables throughout the month as additional data is released.
Closed sales in September were mostly for contracts signed in July and August when 30-year mortgage rates averaged 6.85% and 6.50%, respectively (Freddie Mac PMMS).
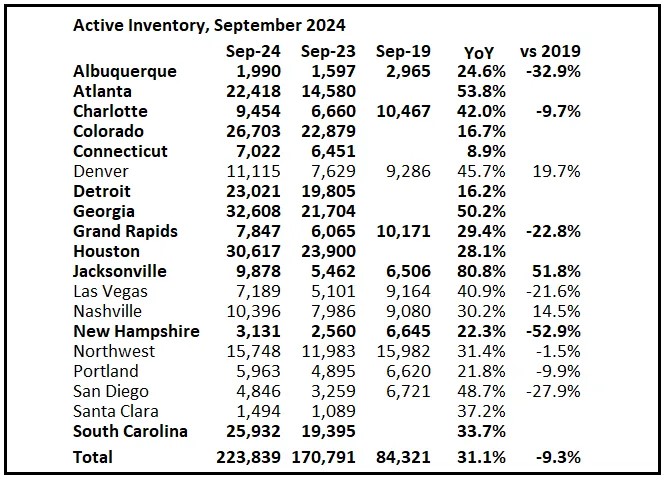
Active Inventory in September
Here is a summary of active listings for these housing markets.
Inventory was up 31.1% year-over-year. Last month inventory in these markets was up 34.0% YoY. A key for house prices will be the level of inventory later this year.
Inventory is down in most of these areas compared to the same month in 2019. Inventory in Denver, Jacksonville and Nashville is up compared to September 2019.
There are significant regional differences for inventory, with sharp increases in the South and Southeast (especially in Florida and Texas). Most of these areas haven’t reported yet for September.
Notes for all tables:
- New additions to tables in BOLD.
- Northwest (Seattle), Jacksonville Source: Northeast Florida Association of REALTORS®
- Totals do not include Atlanta or Denver (included in state totals)
- Comparison to 2019 ONLY includes local markets with available 2019 data!
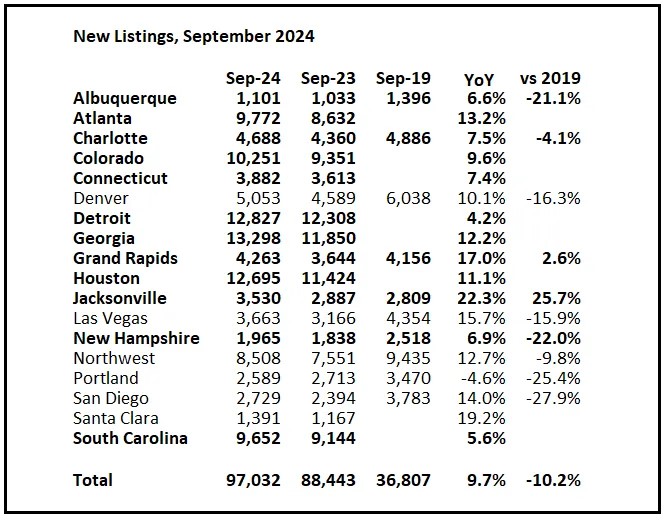
New Listings in September
And here is a table for new listings in September (some areas don’t report new listings). For these areas, new listings were up 9.7% year-over-year.
Last month, new listings in these markets were up 9.4% year-over-year.
New listings are now up year-over-year, but still at historically low levels. New listings in most of these areas are down compared to September 2019 activity (Grand Rapids and Jacksonville are up).
Closed Sales in September
And a table of September sales.
In September, sales in these markets were down 4.2% YoY. Last month, in August, these same markets were down 5.1% year-over-year Not Seasonally Adjusted (NSA).
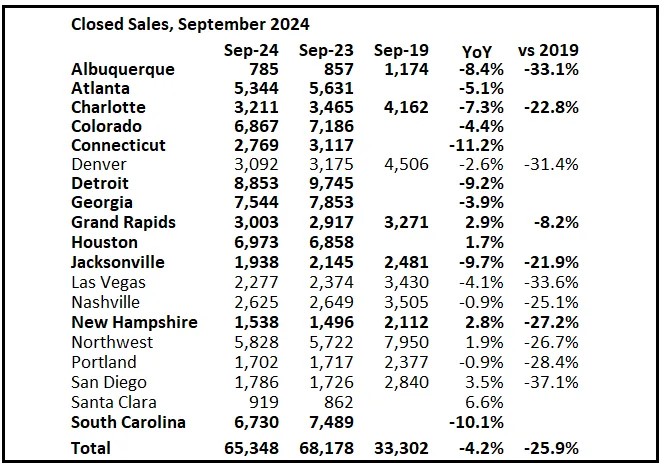
Important: There were the same number of working days in September 2024 (20) as in September 2023 (20). So, the year-over-year change in the headline SA data will be similar to the NSA data. Last month there was one fewer working day in August 2024 compared to August 2023 (22 vs 23), so seasonally adjusted sales were down less than NSA sales.
Sales in all of these markets are down significantly compared to September 2019.
This graph shows existing home sales by month for 2023 and 2024, on a Seasonally Adjusted Annual Rate (SAAR) basis. Last year, the NAR reported sales in September 2023 at 3.98 million SAAR.
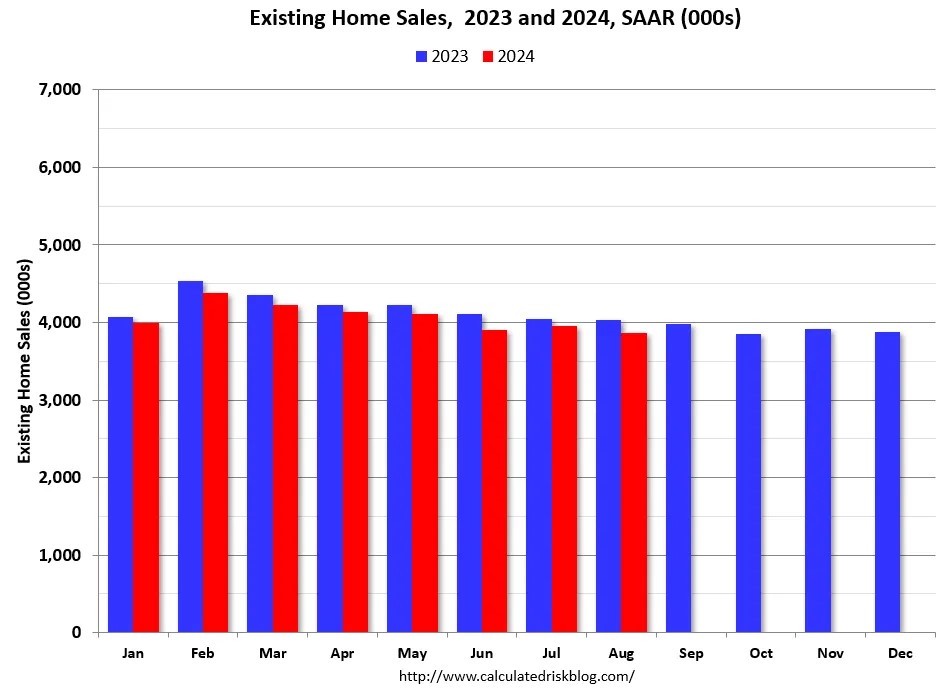
This data suggests that the September existing home sales report will show a year-over-year decline. If sales are up year-over-year, this will be the first year-over-year gain since September 2021. Of course, sales will still be historically low.
Many more local markets to come!