An International Comparison of Healthcare Systems
If you must know before you dive in, this is a long read. It is also a presentation of a report. Very little editing has been done to it. Editing which may have been done is to make it clearer in explanation. I believe it presents a clear explanation of healthcare in the US. My own experience with one group of doctors in the Phoenix was rather disheartening.
I was there for spinal and back issues. They were more interested in my blood pressure, my cholesterol, and my weight. I am not slim and neither am I overweight. My cholesterol is where many would hope to have theirs. And my blood pressure below what they call normal. Sixty-eight to seventy on the diastolic scale.
Why would a doctor want to do such? It is called coding. The more codes, the better the charge to the VA, Medicare, or Medicaid. I dropped them and am working with another group for my spinal issues which will include another operation. So why this report? The first sentence below explains it.
The US came in last in most of the categories analyzed. Considering how much money is spent in the US on healthcare. one would think the US would have better results. The US continues to fail in keeping people healthy.
The successful implementation of the Affordable Care Act (ACA) produced historically low uninsured rates. However, 26 million Americans or between 7 percent and 8 percent still continue to lack coverage. The lack of investment in primary care plays a part. Years of neglect and under compensation for primary care have resulted in nationwide shortages of the clinicians who play a vital role in managing chronic illness. It also shows up in reducing the need for costly and sometimes unnecessary emergency, specialty, and hospital care services.
Quality of coverage is also worse in the U.S. than in other countries. Among Americans with insurance, nearly a quarter are underinsured, facing high deductibles and copayments that reduce the effectiveness of their insurance in assuring access to needed care.
There is more, just read on . . .
Mirror, Mirror 2024: An International Comparison of Health Systems, Commonwealth Fund
Mirror 2024 is the Commonwealth Fund’s eighth report comparing the performance of health systems in selected countries. Since the first edition in 2004, our goal has remained the same: to highlight lessons from the experiences of these nations. Special attention is given to how they might lead health system improvement in the United States.
We compare the health systems of 10 countries: Australia, Canada, France, Germany, the Netherlands, New Zealand, Sweden, Switzerland, the United Kingdom, and the United States. Examined are five key domains of health system performance: access to care, care process, administrative efficiency, equity, and health outcomes (each will be defined further).
In the aggregate, the nine nations we examined are more alike than they are differ with respect to their higher and lower performance in various domains. But there is one exception — the U.S. (see “How We Conducted This Study”). Concerning is the U.S. record on health outcomes. Also, attention is given to how much the U.S. spends on health care. The ability to keep people healthy is a critical indicator of a nation’ capacity to achieve equitable growth. In fulfilling this fundamental obligation, the U.S. continues to fail.
Measuring Performance
Assessing nations’ health systems will be similar to recent editions of Mirror, Mirror, involving 70 unique measures in five performance domains. The data sources for our assessments are thorough and varied. First, we rely on the unique data collected from international surveys the Commonwealth Fund conducts in close collaboration with participating countries. On a three-year rotating basis, the Fund and its partners survey older adults (age 65 and older), primary care physicians, and the general population (age 18 and older) in each nation. The 2024 edition relies on surveys from 2021, 2022, and 2023.
Reliance is also on published and unpublished data from cross-national organizations including the World Health Organization (WHO), the Organization for Economic Co-operation and Development (OECD), and Our World in Data, as well as national data registries and the research literature.
Mirror, Mirror 2024 differs from past reports in certain respects:
– It covers 10 countries instead of the previous 11, after Norway exited the Commonwealth Fund’s international surveys. Norway was the top-ranked country in the 2021 edition of Mirror, Mirror.
– It accounts for the impact of COVID-19 on health system performance, as we use data collected since the onset of the pandemic and do not use data pre-2020.
– It investigates several dimensions of equity. Additionally, to comparisons between residents with above-average and below-average income. This edition examines health system performance differences based on: Gender (limited to male and female because of insufficient sample size to include additional gender identities). Location (rural and nonrural). Patients’ experiences of discrimination, as reported by physicians.
– Comparisons of performance with respect to race and ethnicity were not possible because of data limitations: Many countries do not collect information on these variables and the constructs of identity vary from country to country. To allow for continuity and comparison with previous editions, we present separate analyses for those based only on income and those based on income, gender, and geography combined. Only the analysis based on income was included in our overall rankings. See “How We Conducted This Study.”
Health System Performance Overview
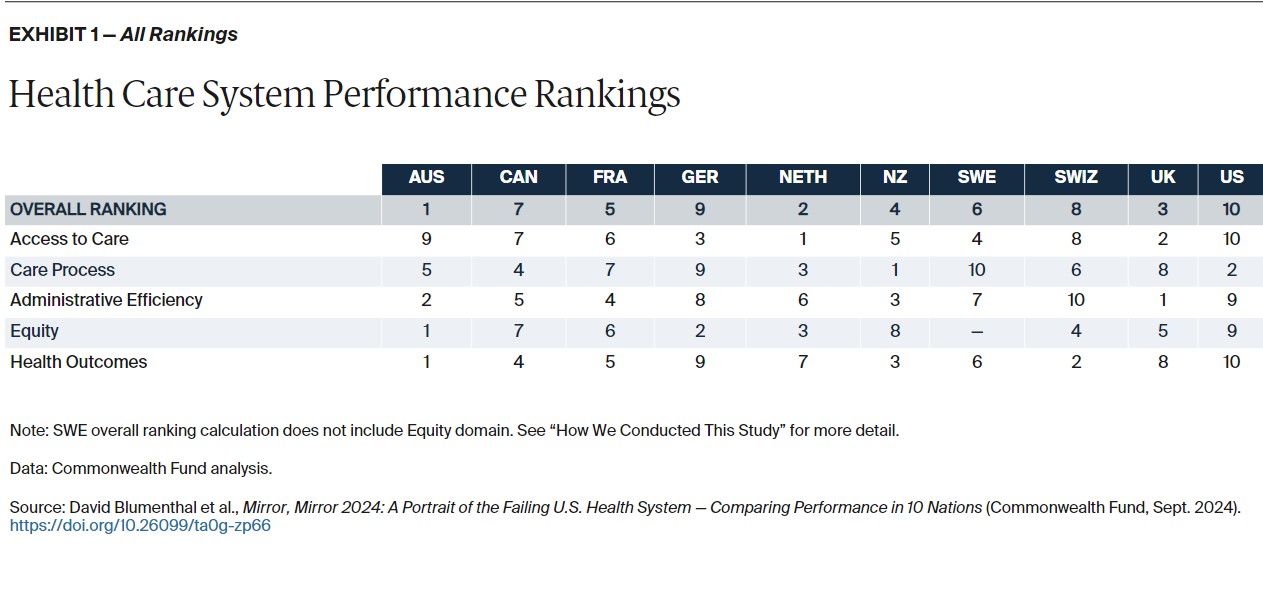
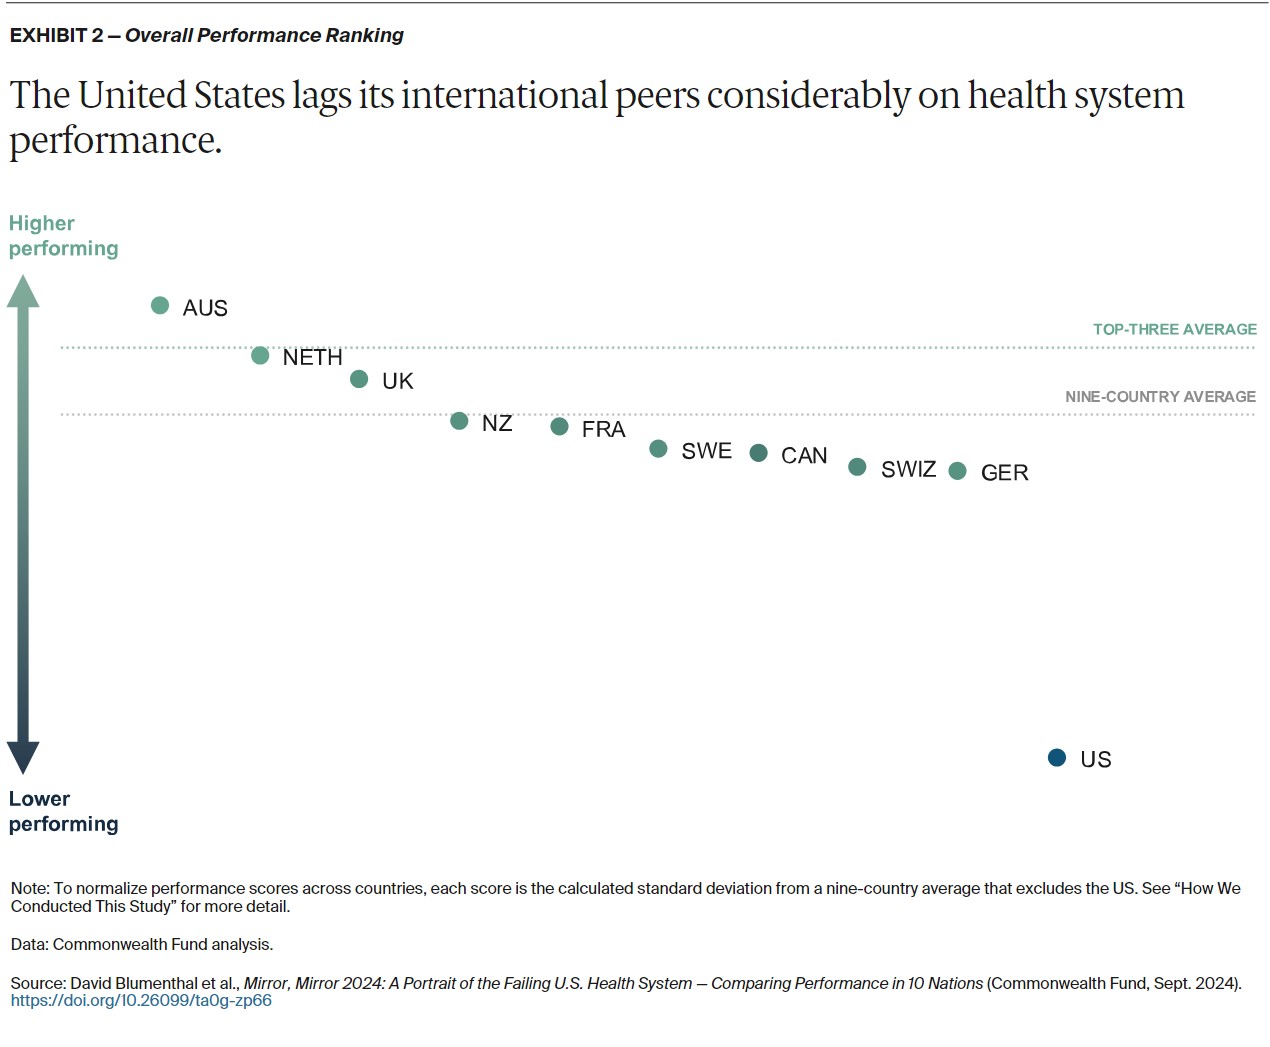
The United States ranks last overall (Exhibits 1 and 2). The three top-performing countries in 2024 are Australia, the Netherlands, and the United Kingdom.
Caution should be taken before drawing conclusions when comparing countries’ overall performance: each country has areas of higher and lower performance, and all countries have something to learn from one another.
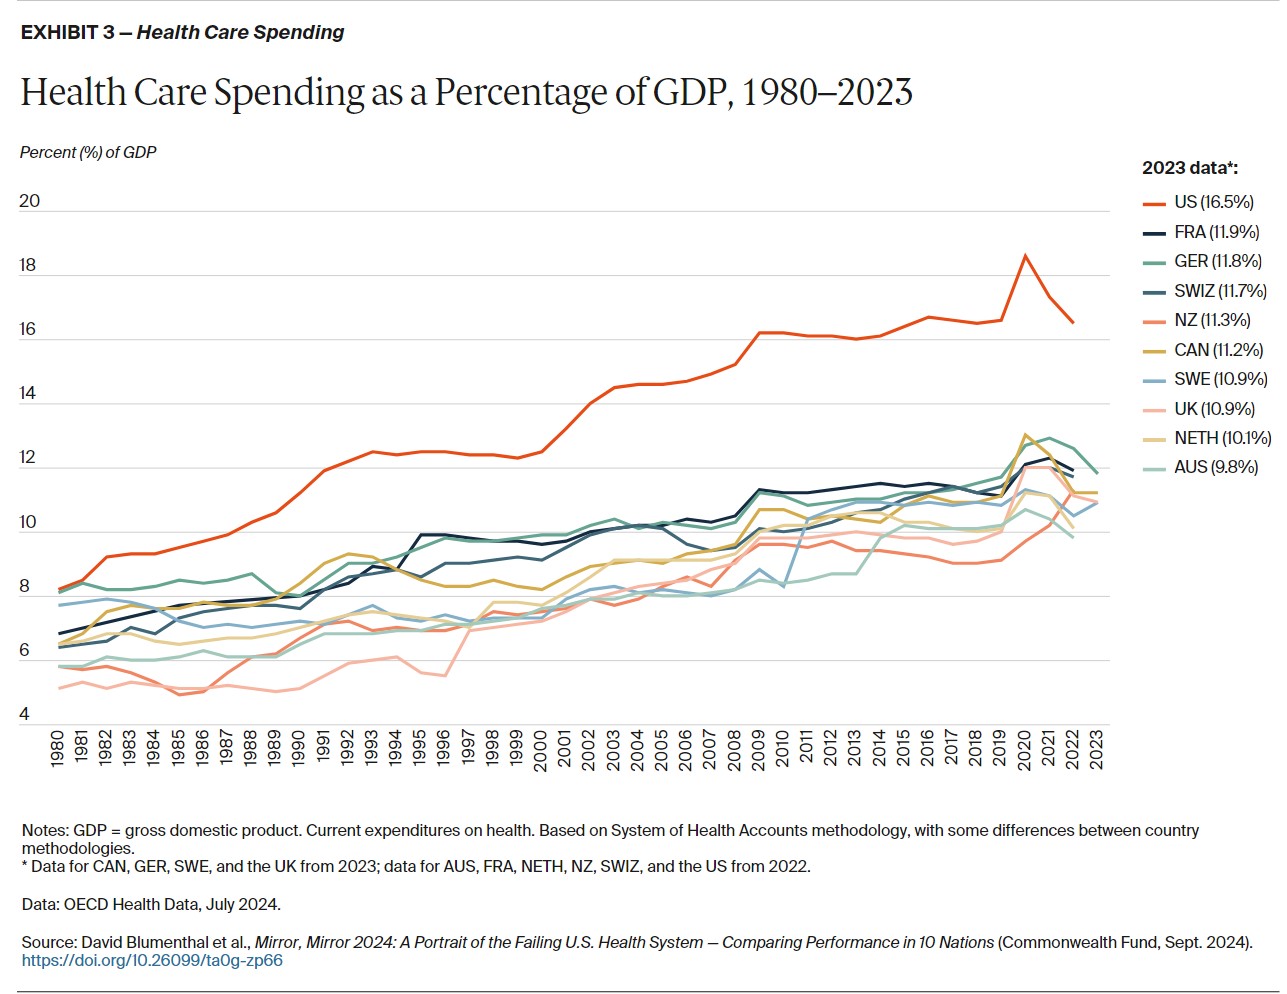
Health care spending is not a measure of performance in the Mirror, Mirror 2024 rankings. It does provide important context for our analysis. The United States is not just an outlier on health system performance. It is also an outlier on health care spending as well.
In 1980, U.S. expenditures were at the high end of the distribution among the 10 nations studied. It was comparable to outlays in Sweden and Germany (8.2% of GDP).
Since then, however the U.S. has far outpaced other nations, spending more than 16 percent of its GDP on health care in 2022 (Exhibit 3). That figure is predicted to exceed 20 percent by 2035.2 In 1980, the other countries included in this analysis spent between 4 percent and 8 percent of GDP, and had increased spending to between 8 percent and 12 percent by 2023.
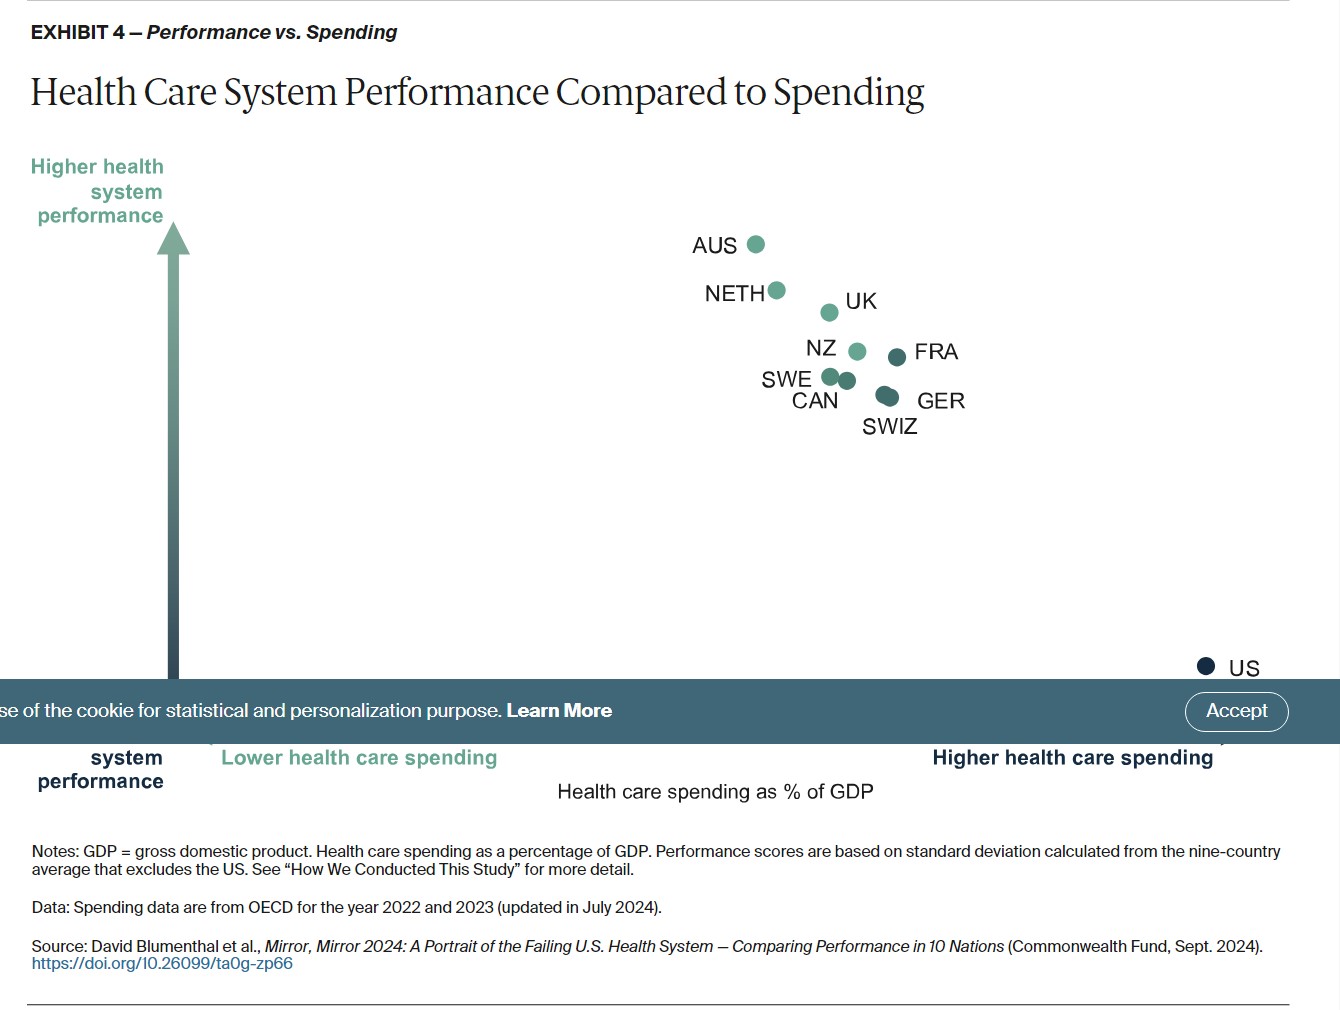
The two countries with the highest overall rankings, Australia and the Netherlands, also have the lowest health care spending as a share of GDP (Exhibit 4). The other countries are clustered closely together — except for the U.S., which spends far more of its GDP on health care yet has by far the worst overall performance.
How Countries Did on Each Performance Domain
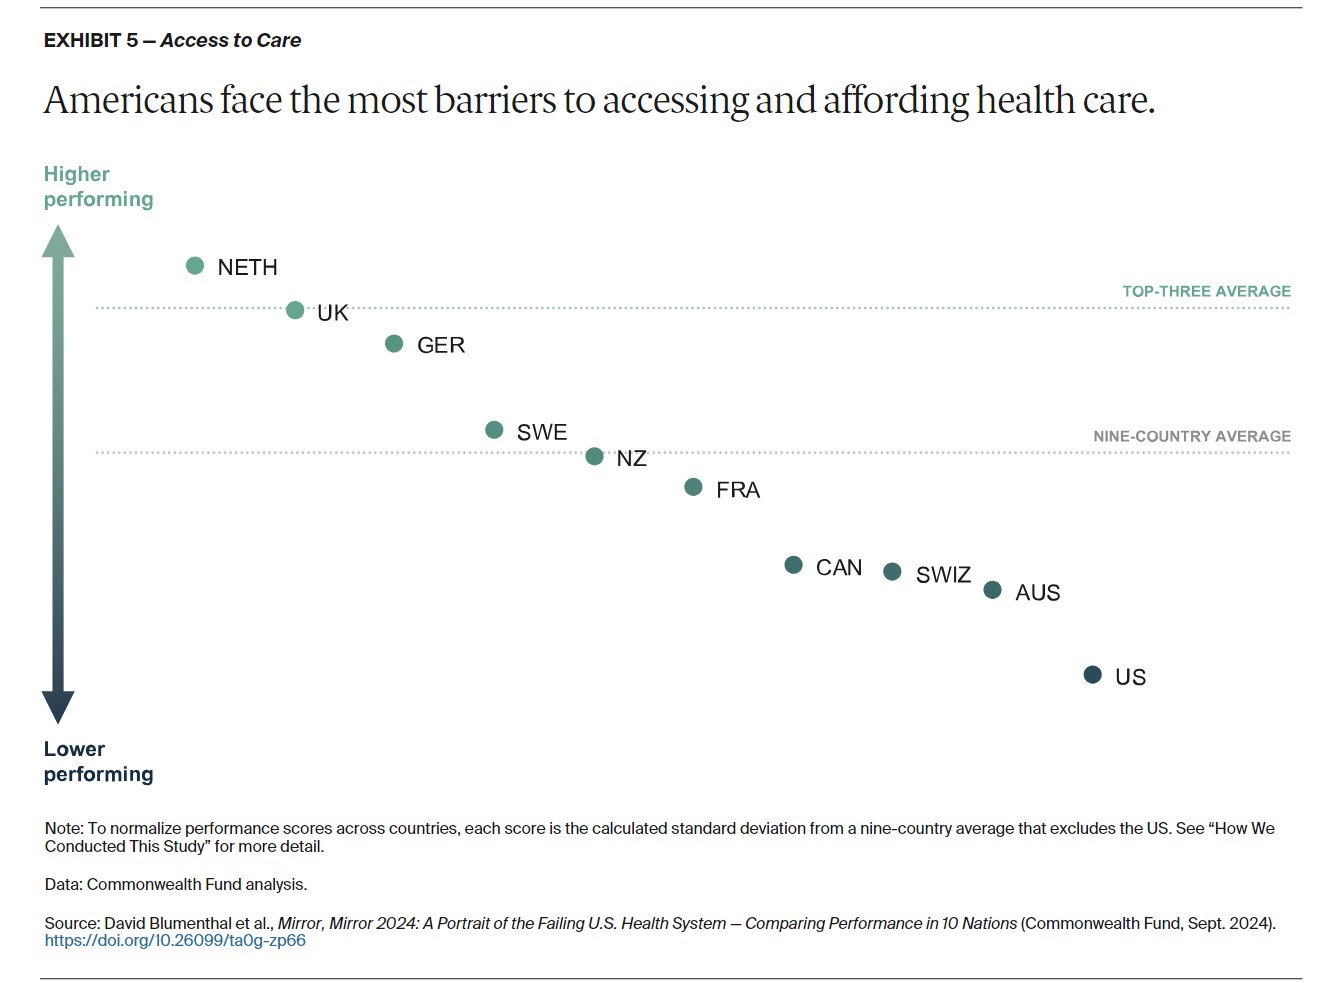
Access to care focuses on the affordability and availability of health services at the population level. The Netherlands, the United Kingdom, and Germany perform best on access overall. Both the Netherlands and Germany rank at the top (or near) on the two components of affordability and availability as shown above. For affordability, the U.K.’s health system is the top one.
Each of the three countries mentioned, excel on measures of affordability because of has low cost-related barriers to care and minimal out-of-pocket expenses. In these countries, universal coverage ensures that copayments for health services are small guaranteeing access and affordability.
In the Netherlands, visits for primary care, maternity care, and child health care are fully covered. other health care services are covered once annual deductible are reached. The National Health Service (NHS) in the UK provides free public health care which includes hospital, physician, and mental health care.
A comparison of out-of-pocket costs . . .
In Germany the copayments are capped at a fixed percentage of income or 2 percent of gross income for all patients and 1 percent for chronically ill patients. Beyond the cap, all care is covered.
In the U.S. for 2024, out-of-pocket limit for marketplace plans under the Affordable Care Act (ACA) can not be more than $9,450 for single plans and $18,900 for family plans. In 2023 an international survey found 41 percent of Americans spent $1,000 or more for out-of-pocket health care in the past year.
In the U.S., the 2024 out-of-pocket limit for marketplace plans under the Affordable Care Act (ACA) cannot be more than $9,450 for single plans and $18,900 for family plans. Our 2023 international survey found that 41 percent of Americans spent $1,000 or more on health care out of pocket in the past year.
The overall top performer in this report faired quite poorly when it came to access to care. Roughly half of Australian patients who do not purchase voluntary health insurance may wait longer to receive services. Affordability is also a problem. New billing incentives are leading to improvement in recent years.
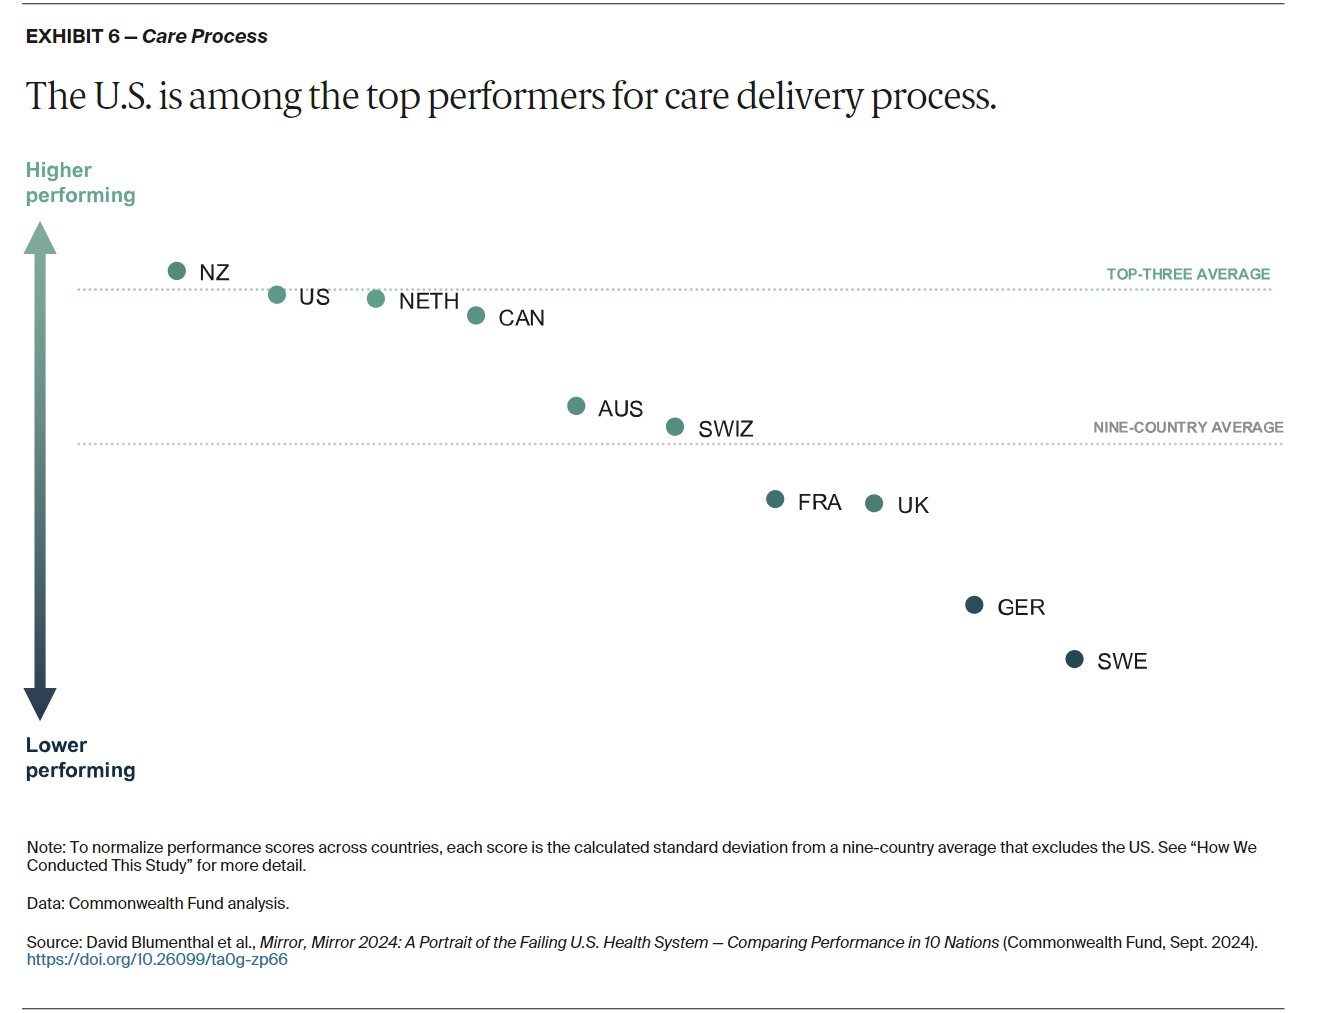
Care process looks at whether the care that is delivered includes features and attributes that most experts around the world consider to be essential to high-quality care. The elements of this domain are prevention, safety, coordination, patient engagement, and sensitivity to patient preferences. Most notably, the U.S. is among the top performers on care process, ranking second (Exhibit 6). New Zealand is first, with Canada and the Netherlands close behind. Sweden performs comparatively poorly.
Strong U.S. performance in the care process domain is the result of the successful provision of preventive services, such as mammograms and flu vaccinations, and an emphasis on patient safety. With respect to preventive care, the U.S. record might reflect the vigorous pay-for-performance policies implemented by Medicare and other payers to reward the delivery of these services.
A concerted focus in the U.S. on patient safety since the beginning of the century has yielded significant reductions in adverse events during hospital stays for heart attack, heart failure, pneumonia, and major surgeries between 2010 and 2019.
Other high performers in care process are New Zealand and the Netherlands. In New Zealand, primary health organizations provide incentive payments to GPs for meeting targets for disease screening, follow-ups, and vaccinations. The Netherlands’ strong primary care system may explain its excellence on measures like quality of patient interactions, continuity of care, and physicians’ knowledge of personal situations. Nearly all Dutch citizens (95%) choose and register with a GP, and they are able to switch GPs at their discretion.
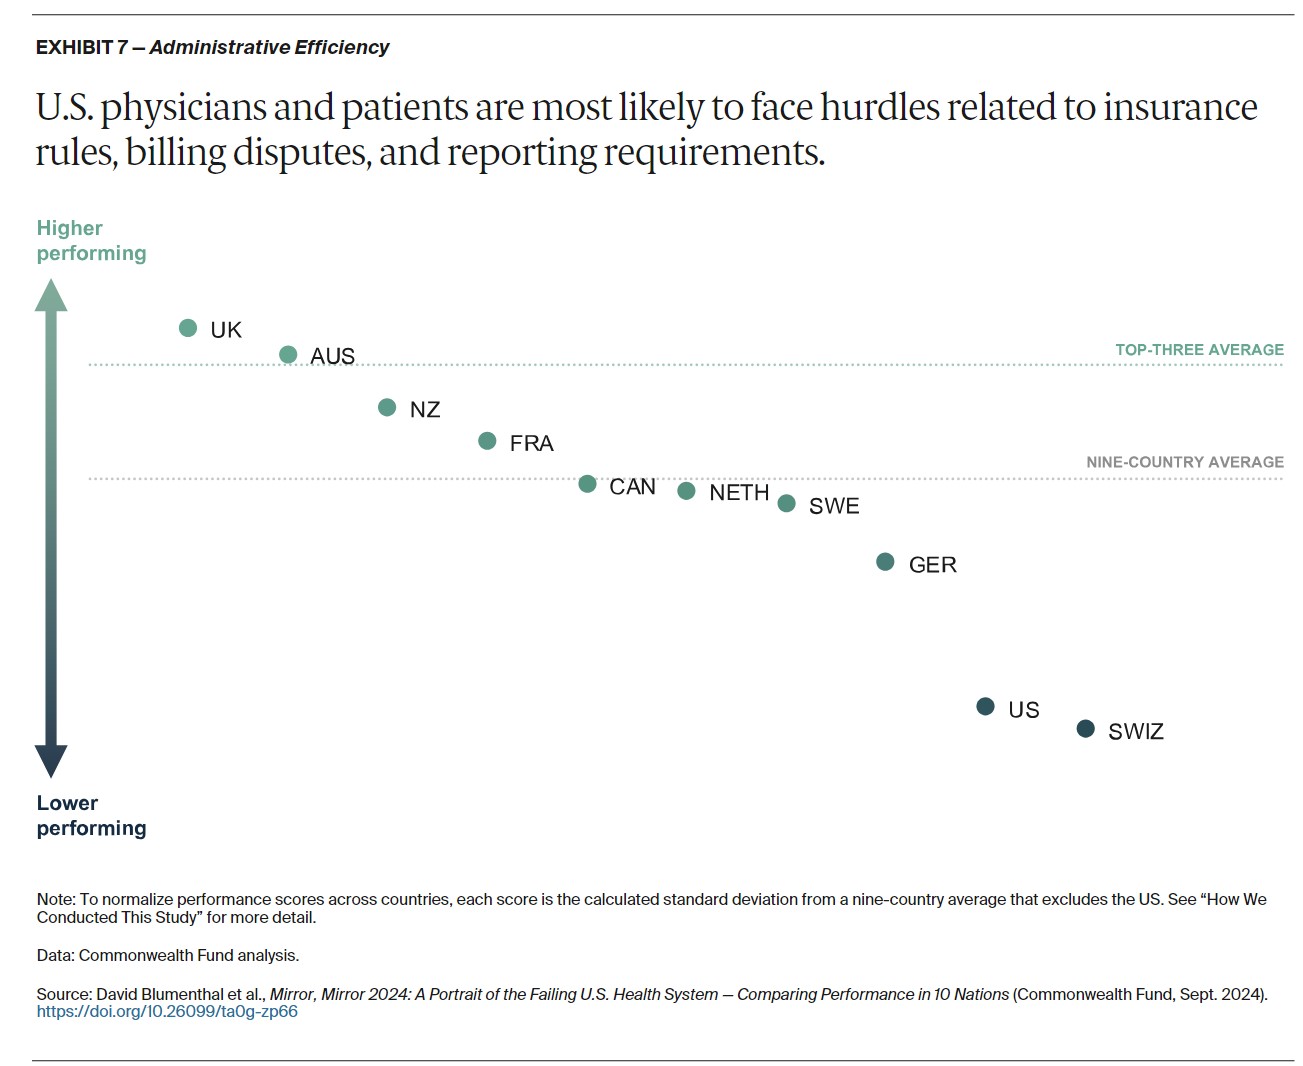
Administrative efficiency focuses on measures of the challenges doctors have in dealing with insurance or medical claims issues; requirements for providers to report clinical or quality data to governmental agencies; and patients’ time spent resolving medical bill disputes and completing paperwork. Australia and the United Kingdom are virtually tied for the best performance on these measures (Exhibit 7). Switzerland and the U.S. come in last.
Australia and the U.K. excel in administrative efficiency by minimizing payment and billing burdens. In Australia, electronic claims processing ensures instantaneous payments from public and private payers. In the U.K., because services are free to patients at the point of care, physicians do not bill patients or the government directly for each service. Instead, they are compensated directly by the National Health Service based on monthly data gleaned from patients’ electronic health records.
Switzerland and the U.S. performed poorly on most of our administrative efficiency measures. Many patients in the U.S. are forced to deal with medical bill issues, and, in both countries, patients are comparatively more likely to seek treatment in emergency departments for conditions that are treatable in outpatient settings, like a primary care physician’s office.
In the uniquely complex U.S. system of public and private payers — featuring thousands of health plans, each with its own cost-sharing requirements and coverage limitations — physicians and other health care providers spend enormous amounts of time and effort billing insurers. Denials of services by insurance companies are also common, necessitating burdensome appeals by providers and patients. The fragmentation of health care delivery across Switzerland’s many cantons and municipalities may also be hindering efficiency for providers and patients alike.
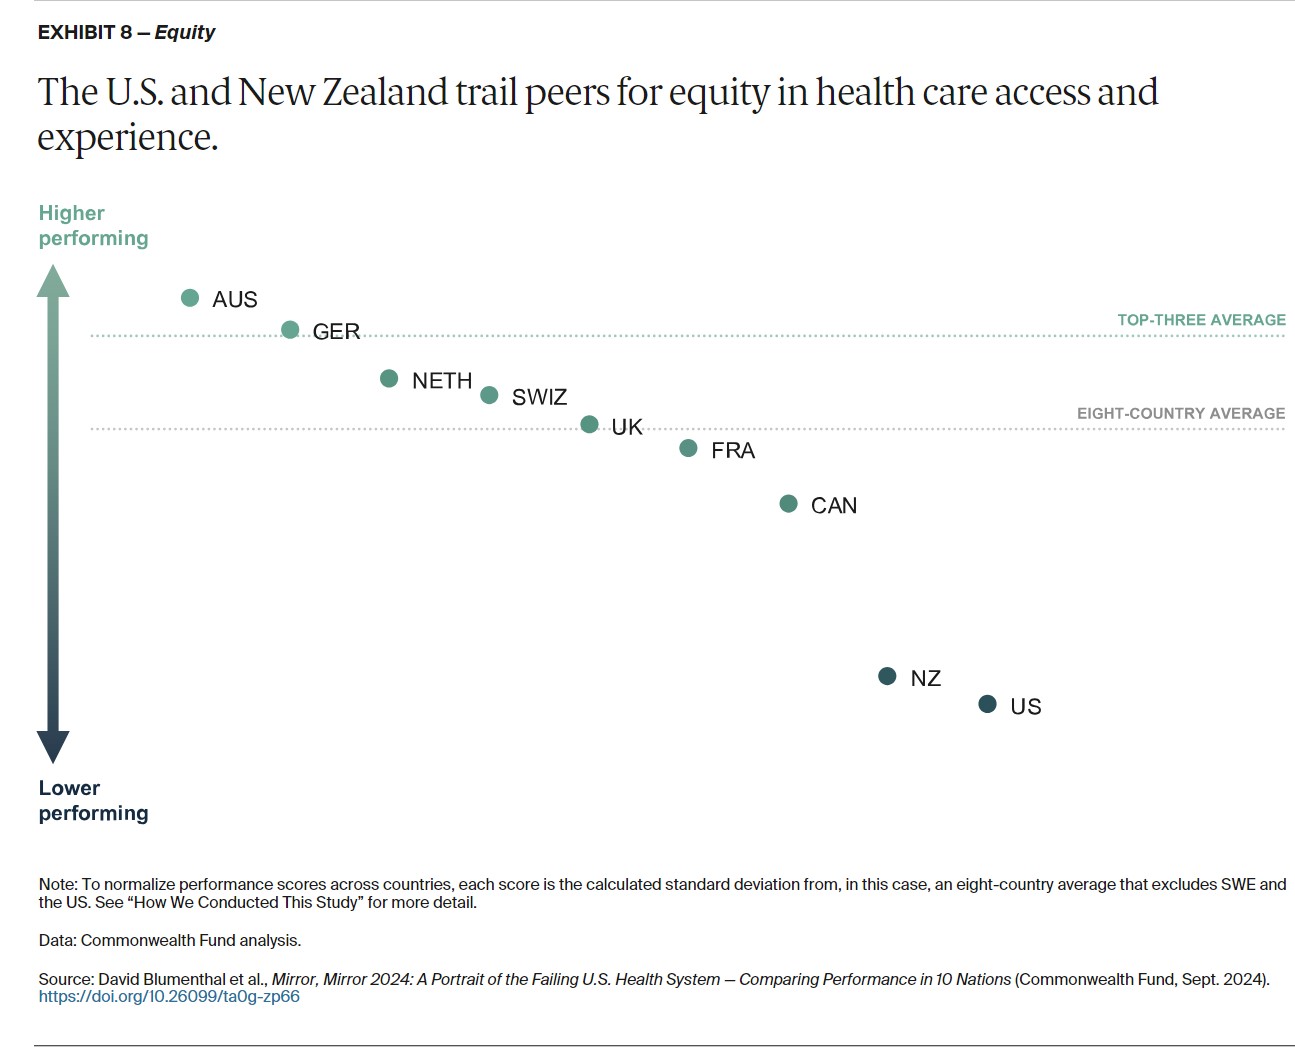
Our Equity domain reflects how people with below-average and above-average incomes differ in their access to health care and their care experience. Australia and Germany rank highest for equity, meaning they are the countries with the smallest differences in health care access and care experiences between below-average and above-average income residents (Exhibit 8). New Zealand and the U.S. rank last on equity, having the highest income-related differences in reported cost-related access issues and instances of unfair treatment or feelings that health concerns were not taken seriously by health care professionals because of their racial or ethnic background.
High performers on equity, including Australia, Germany, and the United Kingdom, have limits on cost sharing (or in the case of the U.K., no cost sharing at all) to ensure that the ability to pay does not constitute a significant barrier to obtaining needed health services. In Germany, out-of-pocket expenses are capped, with the cost of coverage being income-based. And because health coverage is mandatory, nearly everyone has access to a regular doctor.
Australia offers free care in all public hospitals, and the nation’s universal Medicare system provides all Australians with coverage for all or part of the cost of GP and specialist consultations and diagnostic tests, with additional subsidies available for private hospital care. The country’s Pharmaceutical Benefits Scheme, meanwhile, regulates and subsidizes medication costs to keep them affordable.
When we expanded the definition of equity to encompass geography and gender, country rankings changed notably. Switzerland shifted to first, Canada moved up to fifth, and Germany and Australia fell to fourth and sixth, respectively. Australia and New Zealand’s poor performance for rural versus nonrural respondents contributed to their lower rankings. Switzerland moved to first place as a result of its minimal disparities between rural and nonrural areas and between males and females. Switzerland’s small size, along with the nation’s extensive transit options and, as of 2015, increased funding for women’s health, led to improved performance, including fewer childbirth injuries and a higher rate of postpartum checkups.
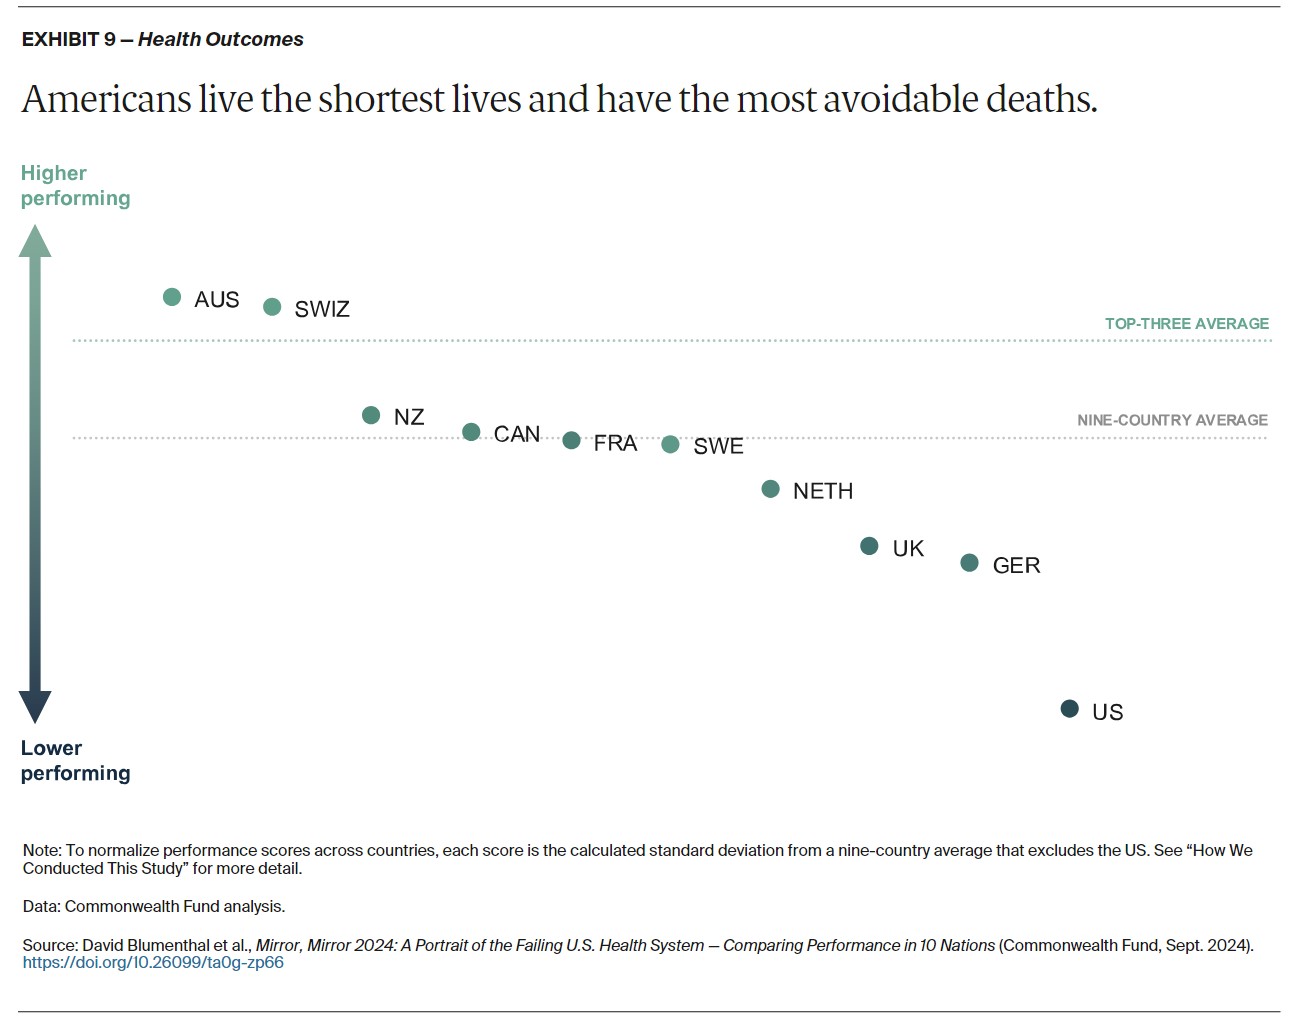
Health outcomes reported here refer to those outcomes that are most likely to be responsive to health care interventions. In this edition, we considered the impact of the pandemic by comparing performance on many measures before and after the start of the COVID-19 pandemic. We also examined specific COVID-related outcome measures. Outcome measures included: life expectancy at birth, excess deaths due to the pandemic, and deaths with preventable and treatable causes, which make up avoidable deaths. Across these measures, Australia, Switzerland, and New Zealand performed the highest among the 10 countries. The United States ranked last (Exhibit 9).
The top three countries’ high performance reflect in part their success in managing COVID-19. Australia implemented stringent border controls, lockdowns, quarantine requirements, and movement restrictions that helped prevent spread.22 New Zealand also reacted swiftly and strongly by closing borders and implementing public health interventions like national lockdowns and stay-at-home orders to prevent transmission, transitioning to a mitigation policy only after vaccinating 87 percent of the population.23 Switzerland, despite an early surge in cases, managed to keep excess mortality low by reopening businesses with effective public health measures like physical distancing, caps of the number of people in physical spaces, and contact tracing coordinated by the Federal Office of Public Health.24
The U.S. ranks last on four of five health outcome measures. Life expectancy is more than four years below the 10-country average, and the U.S. has the highest rates of preventable and treatable deaths for all ages as well as excess deaths related to the pandemic for people under age 75. The ongoing substance use crisis and the prevalence of gun violence in the U.S. contribute significantly to its poor outcomes, with more than 100,000 overdose deaths and 43,000 gun-related deaths in 2023 — numbers that are much higher than in other high-income countries. The U.K. also struggled with COVID-19 outcomes but saw a slight decrease in treatable mortality. The Netherlands, while performing well in other domains, did not stand out for health outcomes compared to other countries.
Mirror, Mirror 2024: An International Comparison of Health Systems | Commonwealth Fund