The Fed and the Press Should Stop Inflating Inflation Expectations
by Steve Roth
Originally Posted at Wealth Economics (June 2023)
Recent headline inflation prints are below the Fed’s target, and falling. That news is a powerful tool for controlling expectations, but the Fed’s not using it.
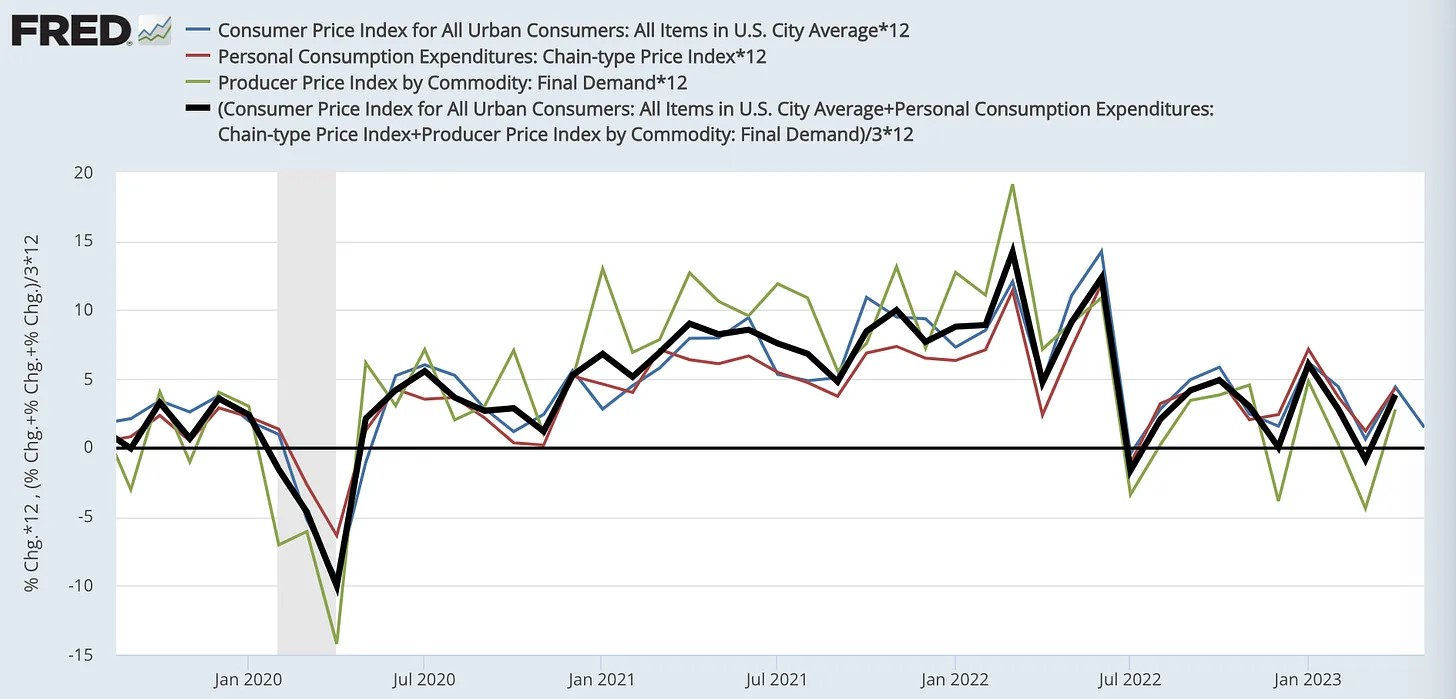
1.5%. That’s the latest headline inflation rate in the U.S. per the May CPI release, and also according to a three-month average of three different inflation indexes that use somewhat different data, baskets, and weightings.
It seems like this low inflation should do much to tame people’s inflation expectations: the Fed’s bugbear. They should be shouting this from the rooftops, right?
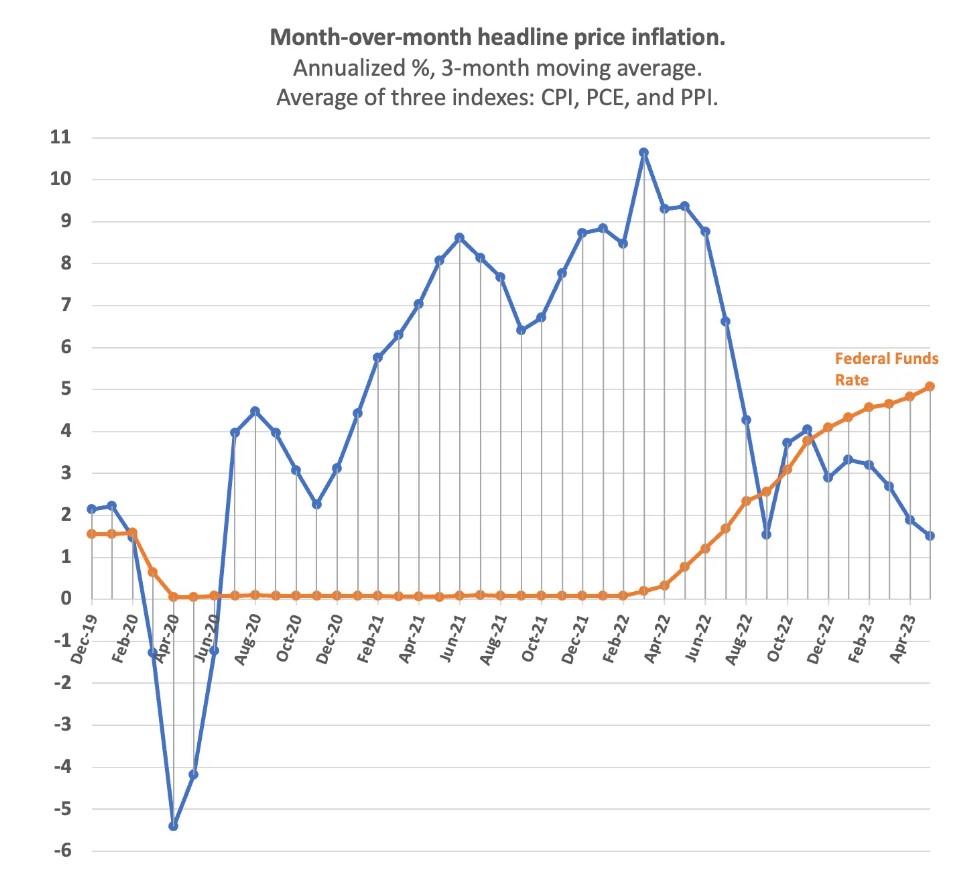
By this multi-index quarterly measure, which smooths out volatile, random, and “head-fake” results without resorting to the distorting extremes of twelve-month year-over-year averaging or pessimistic slices of the data, the news is very good indeed. The measure’s been declining, with one small uptick, for six months. (Following the energy-price-driven cliff-dive in July.) It’s been at or below 4% for nine months. In another key benchmark, the fed funds rate has been (increasingly) above the inflation rate for six months.
But what does the press report? Here from the June 13 New York Times article, headlined “May Inflation Report.” Washington Post delivers the exact same graph.
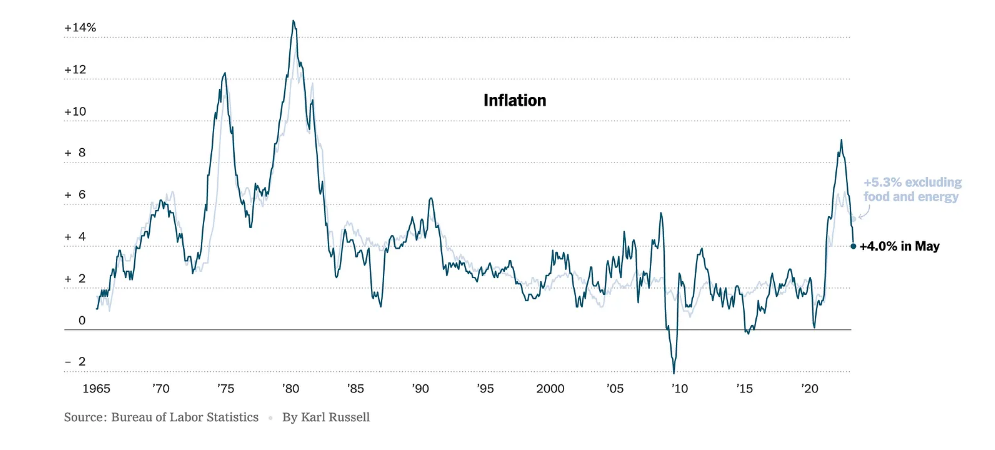
This is not May inflation. It’s (silently) reporting year-over-year (average) inflation for the twelve months June ’22 through May ’23.1 The 14.3% June ’22 print, for instance skews this “May” inflation rate unrealistically upward. The real “headline news” is that monthly inflation is printing at pre-pandemic levels, well below the Fed’s 2% target.
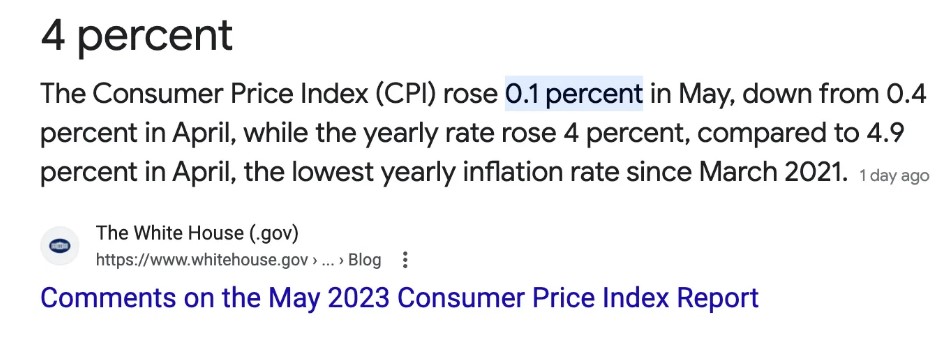
The Times doesn’t just bury the lede; they don’t even report it in the article. (The Post does provide a chart of monthly changes, though not annualized and without discussion.) And they’re not alone. Ask Google, for instance: “what was the CPI inflation rate for May 2023?”
Whither goes the Fed…
The Fed consistently does likewise. In his statements following FOMC rate decisions, for instance, Chairman Powell never mentions recent months’ changes — only year over year. This week’s June 14 statement:
Inflation remains well above our longer-run 2 percent goal. Over the 12 months ending in April, total PCE prices rose 4.4 percent; excluding the volatile food and energy categories, core PCE prices rose 4.7 percent. In May, the 12-month change in the Consumer Price Index came in at 4.0 percent, and the change in the core CPI was 5.3 percent. Inflation has moderated somewhat since the middle of last year.
“Somewhat”? Last June, the PCE and CPI monthly prints were at 11.9% and 14.3% respectively. The Fed’s and Fed-watchers’ “preferred” and more-pessimistic “core” inflation, and other increasingly narrow measures, just amplifies the tendency embodied in YoY averaging when inflation’s falling. There’s always some measure that looks more worrying, even as the good news rolls in.
A cynical view might suggest that the Fed governors are acting out a 1970s/80s childhood trauma, even though today’s conditions — including (un)employment, bond yields/prices, and equity prices — are vastly different. PTSD as monetary policy, with the press blithely following along?
To some greater or lesser extent, people’s inflation expectations are always going to be powerfully affected by current (recent) inflation rates. If controlling expectations to prevent the dreaded “wage-price-spiral” is a key goal for the Fed, aren’t they leaving a powerful policy tool lying on the ground, mouldering? It’s a mystery.
As always, thoughts and suggestions from my gentle readers are much appreciated.
1 Since this screen capture, the Times has updated the fine print at the bottom, adding “Year-over-year change in the Consumer Price Index.” WaPo hasn’t.
Can’t report low inflation rates, then people would want them to cut interest rates!