Is a More Broadly Prosperous Country a Richer Country?
– by Steve Roth
Originally posted at Wealth Economics
If you think human well-being matters, yeah.
If there’s one armchair economic truism that I give high credence to, it’s declining marginal utility. The first ice-cream cone you eat on a hot sunny day delivers a lot of utility. The second, significantly less so. (With ice-cream cones, you pretty quickly get into negative utility.) This “absolute” utility — human well-being, pleasure, “social welfare,” whatever — is of course impossible to measure. (That’s why we have politics.) But it’s still a valid and super-useful concept. Arguably, Job #1 for economics and economists is increasing our collective, aggregate utility.
Is declining utility also true for wealth (or income)? I find that it’s hard to argue otherwise. If you’re broke or close to it, the first $100,000 of wealth has incredible utility. If you’ve already got $10M, you may barely notice another $100K. So I’m gonna say with some assurance that there’s a (steep) declining marginal utility of wealth. Here’s a picture explaining that:
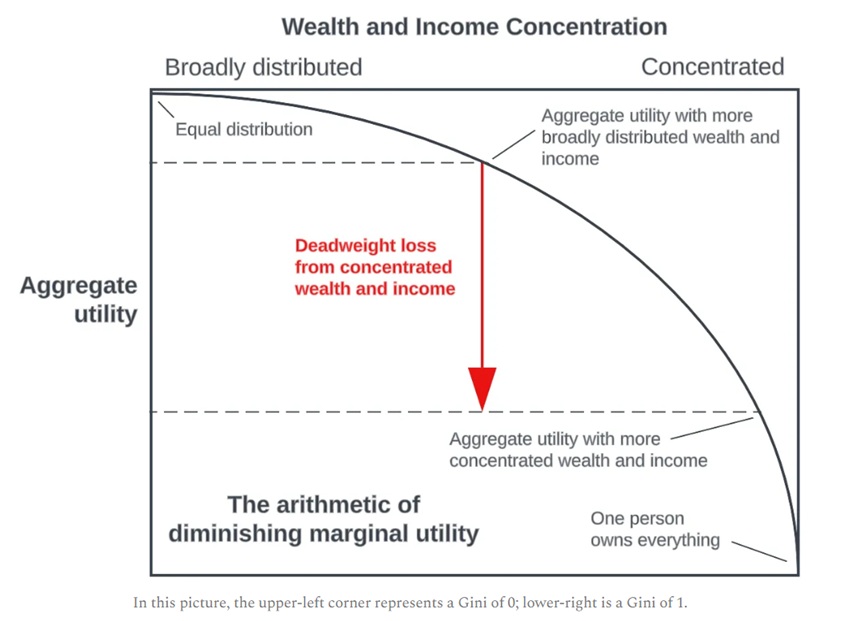
Now imagine two countries with the same wealth per capita. In one, the wealth is highly concentrated into few hands; people at the bottom have very little. In the other it’s broadly distributed. If utility is what matters, the second country is much “richer.” How much richer? It depends on the shape of the wealth:utility curve.
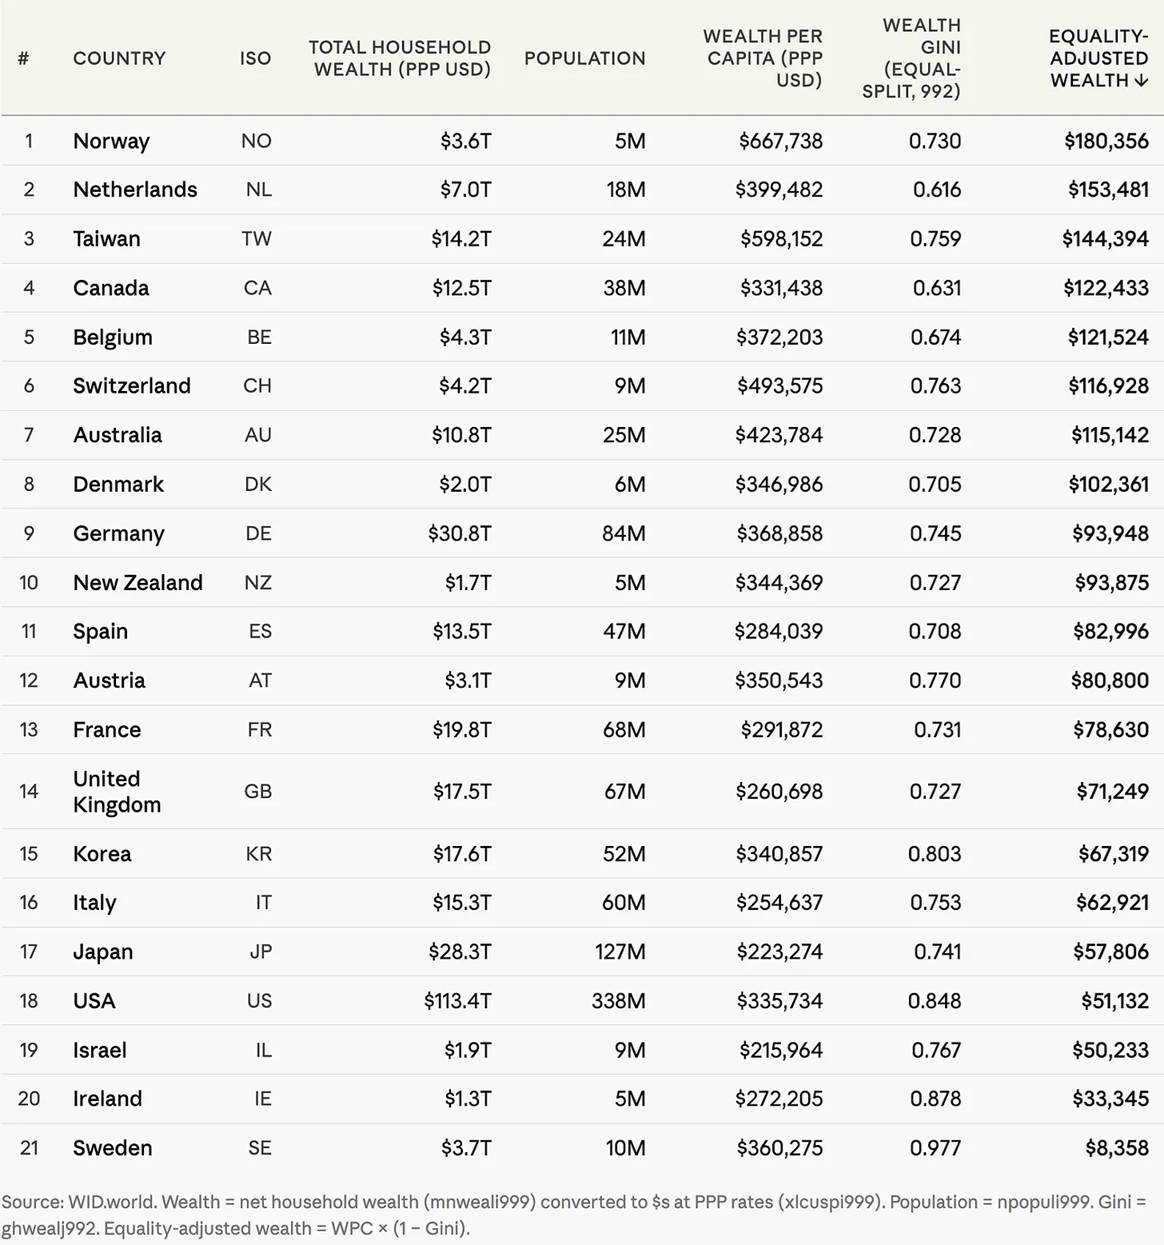
I couldn’t find any data on this idea of countries’ “distribution-adjusted wealth,” so I pulled together a quick example below using data from the World Inequality Database (Piketty & co.’s methodology).1 It adjusts each country’s wealth based on the country’s wealth Gini.
Here’s what that looks like. Think of the final column as an index for ranking/comparing countries, rather than an absolute wealth value. Then look at the ranking, compared to the wealth/capita column.2
I’ll just leave this here with no commentary, hoping it will be useful for folks facing John Rawls’ Veil of Ignorance. Comments, insights, and questions are much appreciated.
Footnotes:
1 I used Claude to extract the pertinent data from WID’s Very Big Files, with some careful spot-checking to vett the numbers it extracted; I found no errors.
2 Sweden is a wild outlier in this table because WID’s methodology gives it a crazy-high wealth Gini of .997. It’s like one person owns almost all Swedish household wealth. Other data sources peg Sweden’s wealth Gini closer to Ireland or the USA.