Industrial production: negative number, important negative revisions
– by New Deal democrat
In the past, industrial production has been the King of Coincident Indicators, since its peaks and troughs tended to coincide almost exactly with the onset and endings of recessions. That weighting has faded somewhat since the accession of China to the world trading system in 1999 an the wholesale flight of US manufacturing to Asia, generating several false recession signals, most notably in 2015-16. But it is still an important coincident measure in the economy.
This month was one of those times where revisions made all the difference. Last month I headlined my note by pointing out that both manufacturing and total industrial production were reported near 10 year highs. But this morning both of those numbers were revised down significantly, and this month was reported down -0.3% for manufacturing and -0.6% for total production (graph normed to 100 as of pre-pandemic high water mark):
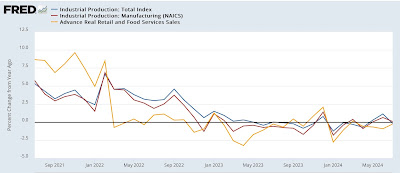
As a result, both series, which had climbed into positive YoY territory, are now back down slightly:
In the above graph, I’ve also added the updated YoY real retail sales YoY data (gold), which shows that both the production and real sales numbers have been flat to trending slightly downward since the end of the last pandemic stimulus over two years ago, with production following sales, as per usual, with a few months’ delay.
Earlier this month I noted that construction is now the pre-eminent element holding up the goods-producing sector of the economy. That’s important because once the goods-producing sector as a whole turns down, the economy as a while typically follows shortly thereafter.
Tomorrow we will get the report on housing, including housing units under construction. If that metric continues to decline, that spells trouble for construction as a whole.
The Bonddad Blog
Industrial production for March is positive, but the overall trend remains flat, Angry Bear by New Deal democrat


It’s time now for a large single rate cut. There is a universal reasonable-sounding assumption that very large and sudden interest rate changes by the Fed would be very destabilizing, and would cause more pain to market participants than do fluctuations in money supply and long term interest rates. But I’ve never seen a study that validates that assumption. Very large rate changes, with blithe contempt for criticism of sudden reversals, may be what the doctor ordered.
In a chaotic system with many sorts of feedback, delays in market response to Fed actions will inevitably cause instability in any control system that seeks to imitate a feedback control system. Unpredictability in delays from plant to error signal will cause zeros of the complex transfer function to migrate into the positive halfplane, thereby causing the plant (economy) to fluctuate wildly, or to peg to a voltage rail (Keynesian inferior equilibrium). But fuzzy logic systems manage to mitigate this weakness, albeit without rigorous mathematical demonstration of stability. Jay Powell would do well to review fuzzy logic control of a double inverted pendulum, in which extreme excursions of motor torque (including overshoot, and frequent reversals of torque) stabilize the plant against very large disturbances (exogenous shocks).
[Robust-adaptive-fuzzy-controller-applied-to-double-inverted-pendulum.pdf (researchgate.net), T‐S Fuzzy System Controller for Stabilizing the Double Inverted Pendulum – Elkinany – 2020 – Advances in Fuzzy Systems – Wiley Online Library]
rick:
Who does one large cut benefit the most?
…the same people who benefit from a string of small cuts.
note that they reported a 7.8% drop in the seasonally adjusted industrial production index for motor vehicles and parts in July. that was down because vehicle manufacturers had been cancelling their normal July retooling shutdowns in prior years due to supply chain issues, skewing the seasonal adjustment…after an inappropriate revision to the seasonal adjustment caused by those one time issues, there was approximately a 8% decrease in the upward seasonal adjustment to July this year compared to last:
https://www.federalreserve.gov/releases/G17/mvsf.htm
note the 23 point difference in the adjustment factor from July to August…last year it was over 30…
and who believes that utility output fell 3.7% in July? (as per this IP report)
southern parts of the country have been pulling natural gas out of storage instead of injecting it due to the heat…seasonally adjusted or not, i can’t see a 3.7% power use drop… look for a revision of that next month