March 2024, Subsidy Enhancements Allow ~ Half of all Enrollees to be Eligible for Free Benchmark ACA Silver Coverage
It has been a while since I have commented on anything ACA related. This popped up in my in-box. I follow Andrew Sprung for the technical side of it. xpostfactoid’s Andrew and Charles Gaba at ACASignups are my go-to people on ACA healthcare and healthcare. To answer this question . . . how can it be half of all enrollees are eligible for free benchmark Silver ACA Coverage?
One only has to look as far as joe Biden’s March 2021 American Rescue Plan Act.
“In 2024, Average Monthly Enrollment in the ACA marketplace will more than double the 2016 total”
by Andrew Sprung
xpostfactoid
The marketplace’s role as an escape valve for some in the “coverage gap” in nonexpansion states continues to expand
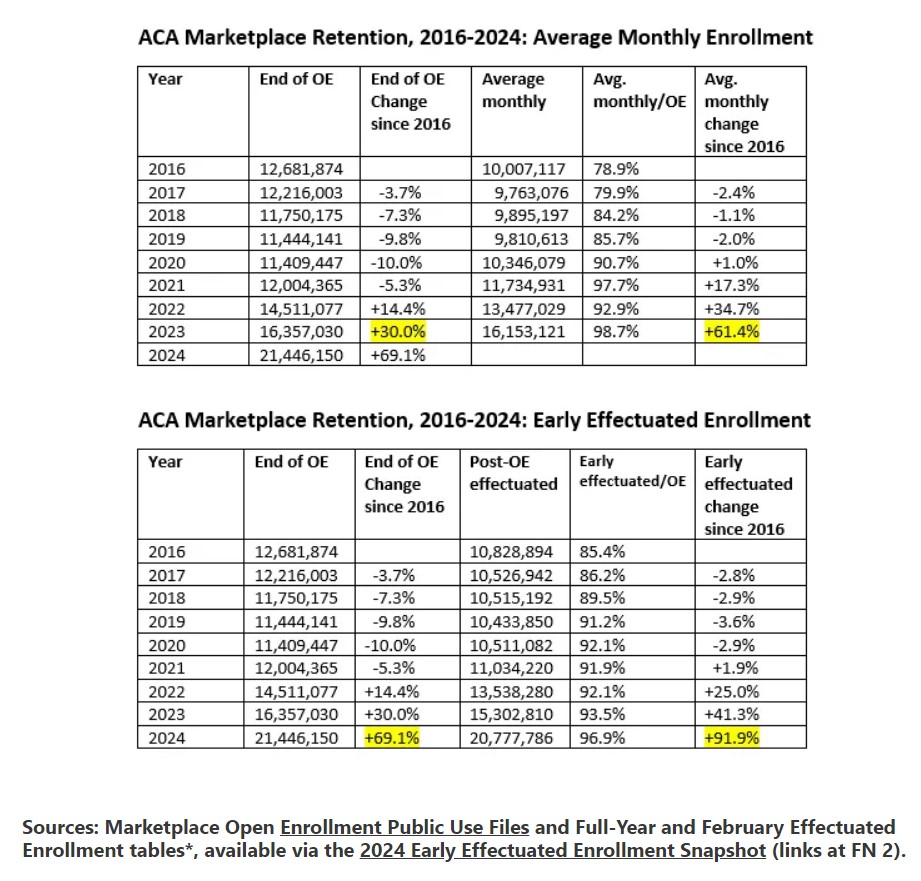
Early this month CMS released its annual report showing “early effectuated enrollment” in the ACA marketplace — that is, enrollment by state as of February, the first month after Open Enrollment ends for the current year (2024) in the federal marketplace, HealthCare.gov. The report also shows Average Monthly Enrollment and month-by-month enrollment for 2023.
In era where, thanks to the subsidy enhancements enacted in the American Rescue Plan Act in March 2021, almost half of all enrollees are eligible for free benchmark silver coverage, the percentage of those who select plans during OEP but never effectuate coverage (e.g., by paying a premium, if one is due) continues to drop. Of those who selected plans during the Open Enrollment Period for 2024, 97% had effectuated coverage as of February.
And in an era where, as of early 2022, prospective enrollees who report income below 150% of the Federal Poverty Level (46% of enrollees in OEP 2024) can enroll year-round, Average Monthly Enrollment as a percentage of initial enrollment during OEP continues to rise. In 2016 — the year of peak OEP enrollment before the ARPA subsidies kicked in for OEP 2022 — enrollment in December was 84.2% of enrollment as of March, the first month after OEP ended that year. By 2020, the last year before mass enrollment was enabled after OEP (thanks to a pandemic emergency Special Enrollment Period in 2021), December enrollment was 94.3% of enrollment in February the first month after OEP. In 2023, December enrollment was 113.5% of enrollment in February.
The upshot: enrollment growth in the post-ARPA era is far higher when measured in terms of Average Monthly Enrollment or Early Effectuated Enrollment as opposed to OEP plan selections. The two tables below illustrate. I’ve emphasized enrollment growth since 2016, the peak year for OEP on-exchange enrollment until 2022.