The Fed’s New Supply Chain Pressure Gauge just went Negative
Putting on a different hat today. My background includes supply chain management. I am looking at what the industry experts are seeing and whether I agree with them. Much of what I have seen over the last two years is a repeat of 2008. And again, we are waking up late to the beginning of the end of the same issues. No Cassandras amongst us.
Good article . . .
The Fed’s supply chain pressure gauge just went negative, freightwaves.com, Greg Miller.
In January 2022, the world was being driven by a demand and structural supply chain crisis. To foretell such issues, the New York Federal Reserve unveiled a new barometer to measure the inflation fallout and calling it the Global Supply Chain Pressure Index (GSCPI).
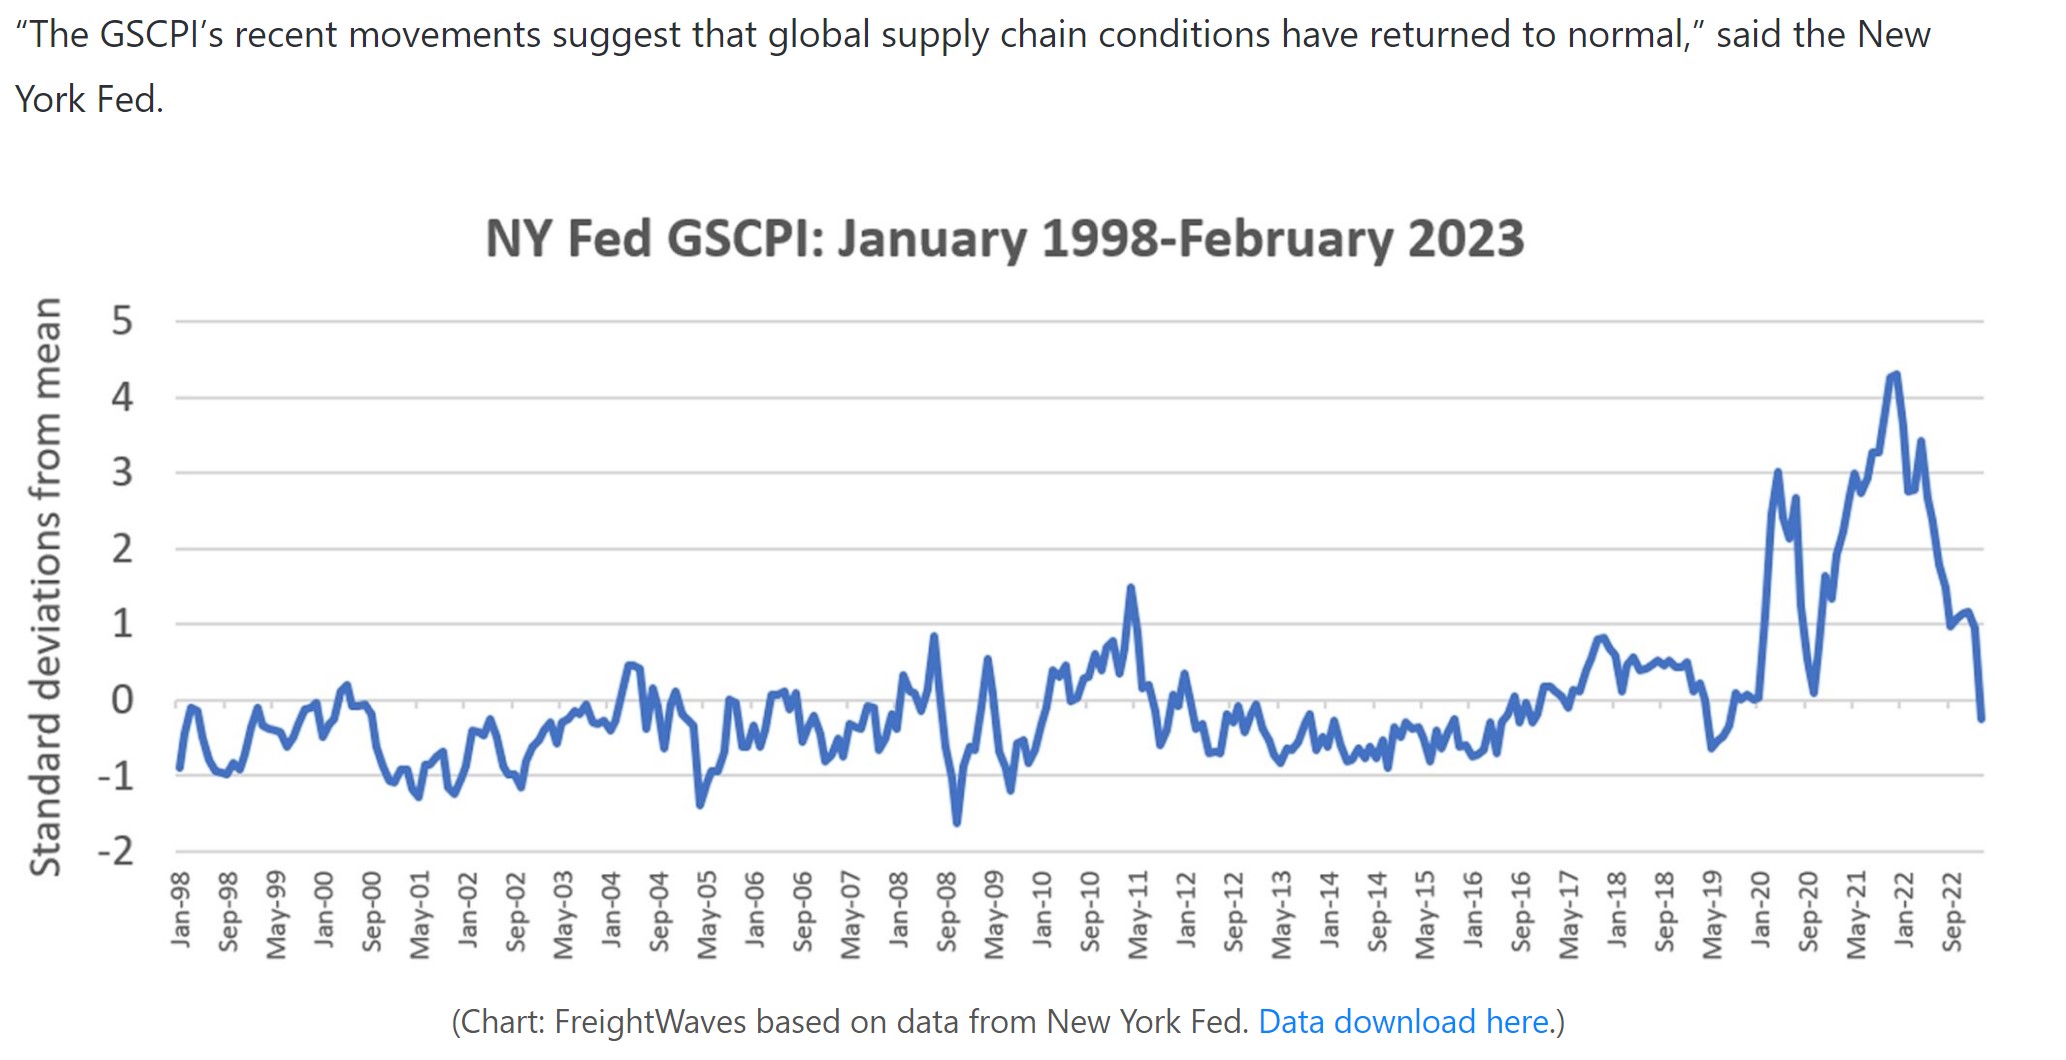
The GSCPI’s purpose was to “capture supply chain disruptions using a range of indicators,” to measure standard deviations from the historical mean. It peaked at 4.31 standard deviations in December 2021. In trading parlance, this is a four-sigma or once-in-a-century event.
The reasons for the peak at this level? Consider increased demand, industry starting up again, deliberate failure to meet demand, not increasing throughput at the ports, etc. I also experienced similar in 2008 just not to this extent. The Fed is being kind by calling this supply chain disruptions. Some of this is manipulation.
We have seen one extreme of 4.31 standard deviations. The index has also hit another interesting milestone on Monday, March 6. The New York Fed was reporting the February’s index reading had nose-dived to a negative or a minus 0.26 standard deviations. As reported this is the lowest reading since August 2019. The New York Fed . . .
“The GSCPI’s recent movements suggest that global supply chain conditions have returned to normal.”
You can see the wild swings in the graph immediately below.
Sitting in my $250 mllion/year warehouse, if I saw this, I would start to plan fewer and maybe smaller orders of materials. My lead time out of China was a theoretical six weeks and I was carrying inventory or swag. I am not sure people react in this manner anymore. It is too much computer driving the material needs. Not enough intuition or application of experience anymore.
The index had fallen throughout last year. Improvements halted in September, with the gauge slightly worsening through December. Fed economists partly blamed COVID issues in China. The Fed said last month’s sharp improvement was due to the end of those “temporary setbacks” and a reduction of delivery times to Europe.

On Feb. 22, New York Fed economists said that factors “captured by [the GSCPI] were strongly associated with inflationary developments measured by the producer price index and consumer price index.”
They suggested that if “the GSCPI falls back to its historical average over 12 months, the model would project a substantial easing of consumer price inflation over 2023, to below 4% … consistent with a soft-landing scenario.” (Their views do not necessarily represent those of the Fed.)
Inflation upside from easing bottlenecks
Chairman Jerome Powell presentation of current state at a hearing of the Senate Committee on Banking, Housing and Urban Affairs.
Powell described the evolution of inflation since the pandemic began as a two-chapter story. In the first, consumer demand for goods spiked, overwhelming the global supply chain and stoking inflation. In the second — where we are now — the supply chain situation is largely in the rearview mirror and core inflation is instead driven by spending on housing, and even more so, services. Powell . . .
“The initial outbreak was all about spending on goods. People couldn’t spend on services so goods spending went way up. And the global supply chain — many, many goods are imported — the global supply chain just collapsed.
That was the source of the original inflation. But it has now spread over the last two years to housing and all the rest of the service sector. Supply chain bottlenecks have eased … [and] we have been seeing goods inflation coming down now for some time. It’s still too high but it’s coming down.
In housing, the new leases being signed tell us [housing inflation] will come down in the next six to 12 months. But the service sector — financial services, medical services, travel and leisure, all of those things — that’s really the source of the inflation we have now, which has not had much to do with the supply chain.”
Curbing this non-supply-chain-related inflation will be a “challenge,” he said, indicating that the Fed may increase rates “higher than previously anticipated,” a comment that sent the Dow down 575 points.
AB: The problem with these statements are the lack of vision. Not only with the Fed, nut also with industry. There is no attempt to head off some of the issues incurred in the beginning and later when the pandemic appeared to be easing.
GSCPI methodology
Is the supply chain fully back to normal, as implied by the GSCPI?
The GSCPI methodology has been the subject of some criticism since the index’s inception. From a shipping industry perspective, the index composition may seem peculiar.
Of the 27 components, 21 are purchasing managers indexes for three subcomponents (delivery times, backlogs and purchased stocks) for seven economies (EU, China, Japan, South Korea, Taiwan, U.K. and U.S.).
Only six components are shipping indexes.
Four are U.S. Bureau of Labor Statistics airfreight indexes (Asia-U.S., U.S.-Asia, Europe-U.S. and U.S.-Europe). Only two are related to ocean freight: the Baltic Dry Index (BDI) and Harpex.
The BDI is not a container shipping index. It measures dry bulk freight rates and is heavily influenced by Chinese iron ore imports.
The BDI was indeed inflated by supply chain issues in 2021. Specifically, it was the congestion at Chinese ports resulting from COVID restrictions. However, over most of the period covered by the GSCPI (since 1998) the BDI has been largely driven by vessel supply issues. The BDI spiked in 2007-2008 due to under-capacity and slumped in the decade after the financial crisis due to rampant over-ordering of new buildings.
The Harpex index does not measure container freight rates, it measures container-ship charter rates. Even as port congestion has largely vanished, the Harpex remains more than double pre-pandemic levels.
Not fully back to normal yet
At the Hellenic/Norwegian Chambers of Commerce shipping conference in January, Casey O’Brien, corporate counsel at Amazon (NYSE: AMZN), said the idea that “we are back to normal in the supply chain is optimistic. I don’t know that we’re back to normal, although it’s certainly heading that way.” (O’Brien noted that her views were her own, not necessarily Amazon’s.)
Other indicators confirm a move toward normalized supply chain conditions but not a full return.
Flexport publishes a weekly measure called the Ocean Timeliness Indicator (OTI). It tracks the number of days from the time containers leave factories in Asia to when they exit terminal gates at U.S. ports on the westbound route and European ports on the eastbound route.
As of Monday, the trans-Pacific OTI was at 74 days, down 35% from the all-time high of 114 days in early January 2022. However, the trans-Pacific OTI has actually increased over recent weeks and is still 61% above the average in April-December 2019.
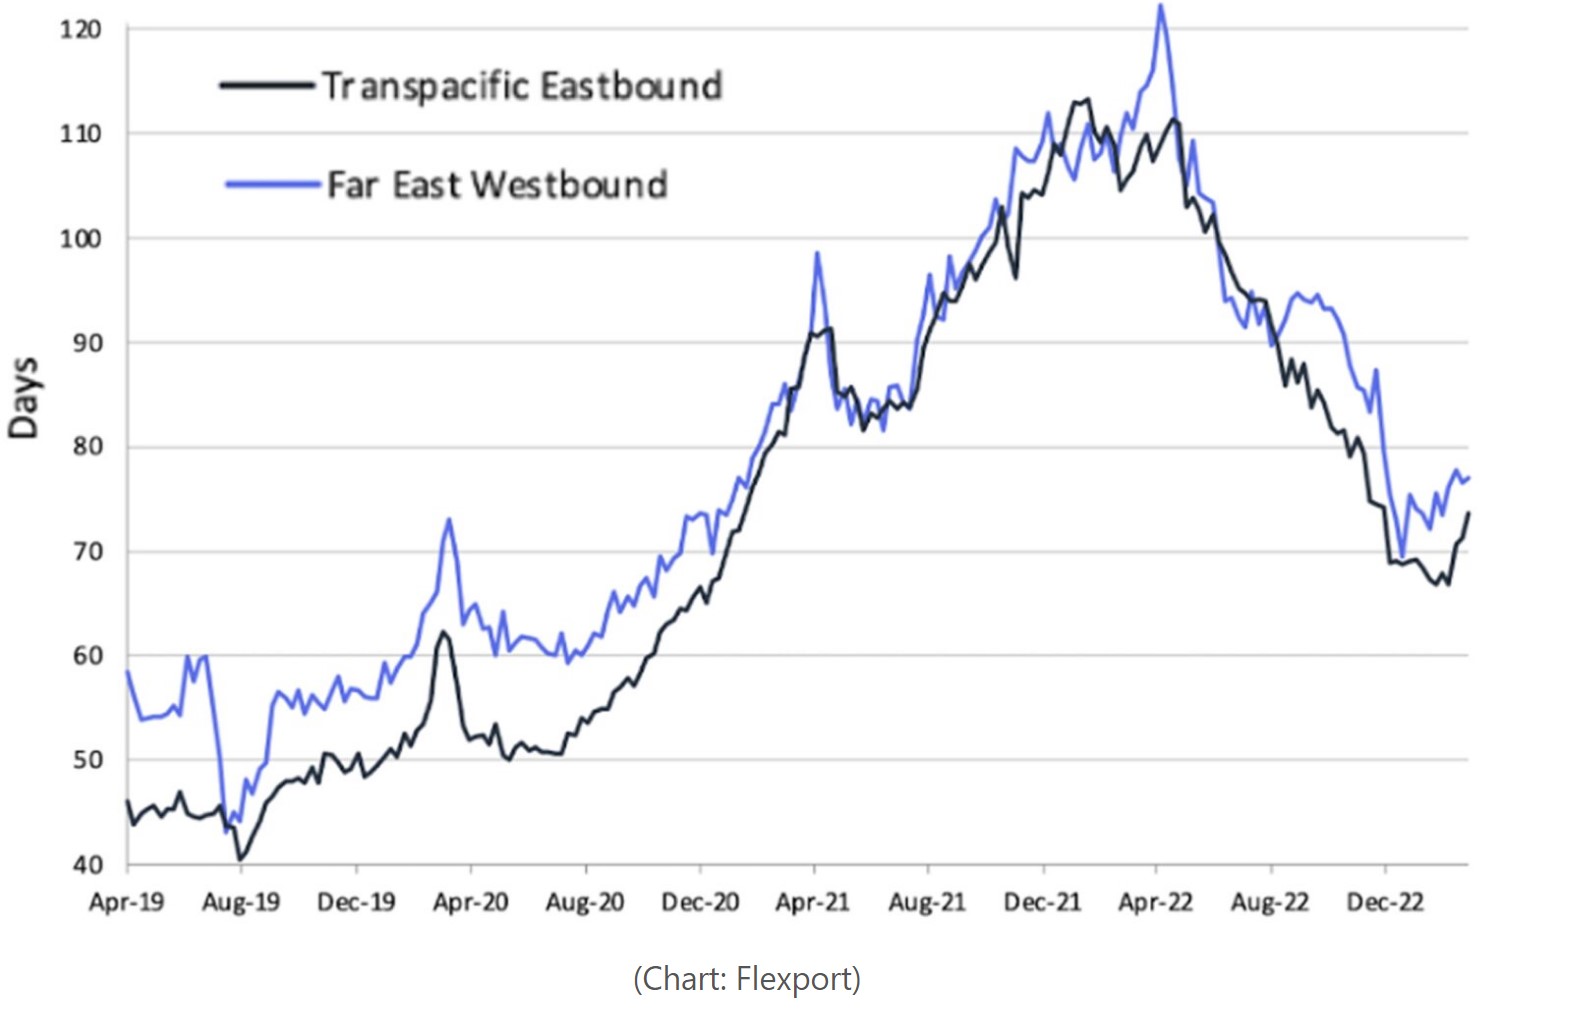
AB: The 74 days is getting closer to what I had experienced. There could still be issues at the port.
Flexport:
“While the worst of the late 2021 build-up in congestion may be over, levels are still well above pre-pandemic levels,”
on Monday.
Another bellwether, ocean carrier service reliability, shows there’s still a long way to go. Whether a shipping service arrives on time or not is still basically a coin toss, according to the latest data from Sea-Intelligence.
It determined that global service reliability was 52.6% in January (slightly worse than December). The January average was well above the nadir of 30.4% hit in January 2022, but still far below the 2018-2019 pre-COVID average of 74.3%.
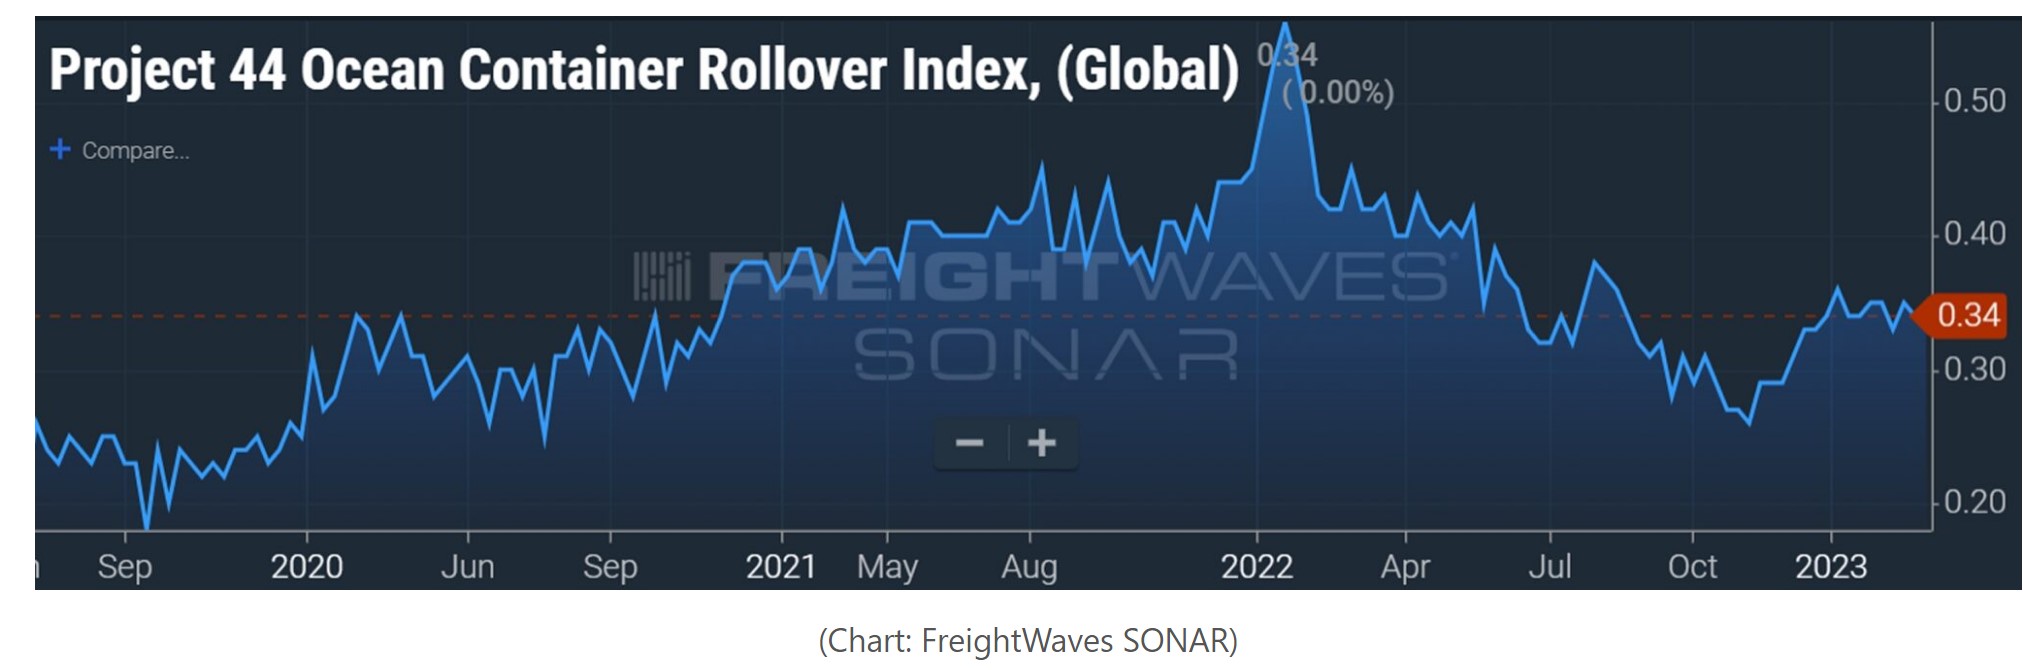
Data on cargo “rolls” paints the same picture: big improvements but not a full normalization. Project44 data on FreightWaves SONAR tracks the global weekly percentage of cargo arriving on a different ship than it was originally booked.
As of the last week of February, this indicator was down 39% from its peak in January 2021. But cargo rollovers increased from the lows hit in November. They were still 48% above the average in the fourth quarter of 2019, prior to the pandemic effect on supply chains and inflation.
Imports sink again as wholesale inventories remain bloated (freightwaves.com)
West Coast wipeout: Los Angeles, Long Beach imports still sinking (freightwaves.com)