Interest rates, the yield curve, and the Fed chasing a Phantom (lagging) Menace
Interest rates, the yield curve, and the Fed chasing a Phantom (lagging) Menace
There’s a lot going on with interest rates in the past few days.
Mortgage rates have increased above 7%:

This is the highest rate since 2008. Needless to say, if it lasts for any period of time it will further damage the housing market.
The yield curve has almost completely inverted from 3 years out (lower bar on left; upper bar shows a similar curve in April 2000, 11 months before the 2001 recession):

As of this morning, the curve is normally sloped from the 3.12% Fed funds rate up through the 3 year Treasury, which is yielding 4.22% (which, as an aside, is a mighty tasty temptation to buy medium maturity bonds). Beyond that, with the exception of the 20 year Treasury, each maturity of longer duration is yielding progressively less. If this is like almost all recessions in the last half century, the short end of the yield curve will fully invert (i.e., Fed funds through 2 years as well) before the recession actually begins. Although I won’t show the graph, the yield curve *un*-inverted before the last two recessions even began, immediately or shortly after the Fed began to lower rates again.
On the issue of rents, house prices, and owners equivalent rent, Prof. Paul Krugman follows up on the fact that OER is a lagging measure. Today he touts the monthly decline in new rental lease prices as possibly signaling a downturn in inflation:


He’s referring to the “National Rent Index” from Apartment List, which Bill McBride has also been tracking. Because it tracks rents in only new or renewed leases, it picks up increases or decreases more quickly than those indexes that measure all rentals (including those that were renewed, e.g., 9 months ago).
I don’t think the index is quite the signal Paul Krugman does, because it is not seasonally adjusted, and rents typically decrease in the last 4 months of each year:

Here is the cumulative yearly index for each of the past 5 years:

The -0.1% non-seasonally adjusted decrease in September this year is on par with that of 2018, and less of a decline in September 2019 or 2020. For the first half of this year, rents were increasing at a faster, and accelerating, rate compared with 2018 and 2019. Since June have rent changes been comparable with (and not more negative than) those two years.
I thought I would compare Apartment List’s with with the Case Shiller house price index, below:

Note that house prices broke out to the upside YoY beginning in late spring 2020, while apartment rents did not do so until early 2021. There were rent increase moratoriums in place during the pandemic, which may have affected that comparison. Still, it is cautionary that for the limited 5 year comparison time we do have, house price indexes moved first.
Finally, what would the Fed have done if it had used the Case Shiller index instead of owners equivalent rent in its targeted “core inflation” metric?
Via Mike Sherlock, here’s what the “Case Shiller [total, not core] CPI” looks like through last month:

Here’s another way of looking at the data, comparing the monthly % changes in the Case Shiller national house price index (blue), owners equivalent rent (red, right scale), and core CPI (i.e., minus food and energy) (gold, right scale):
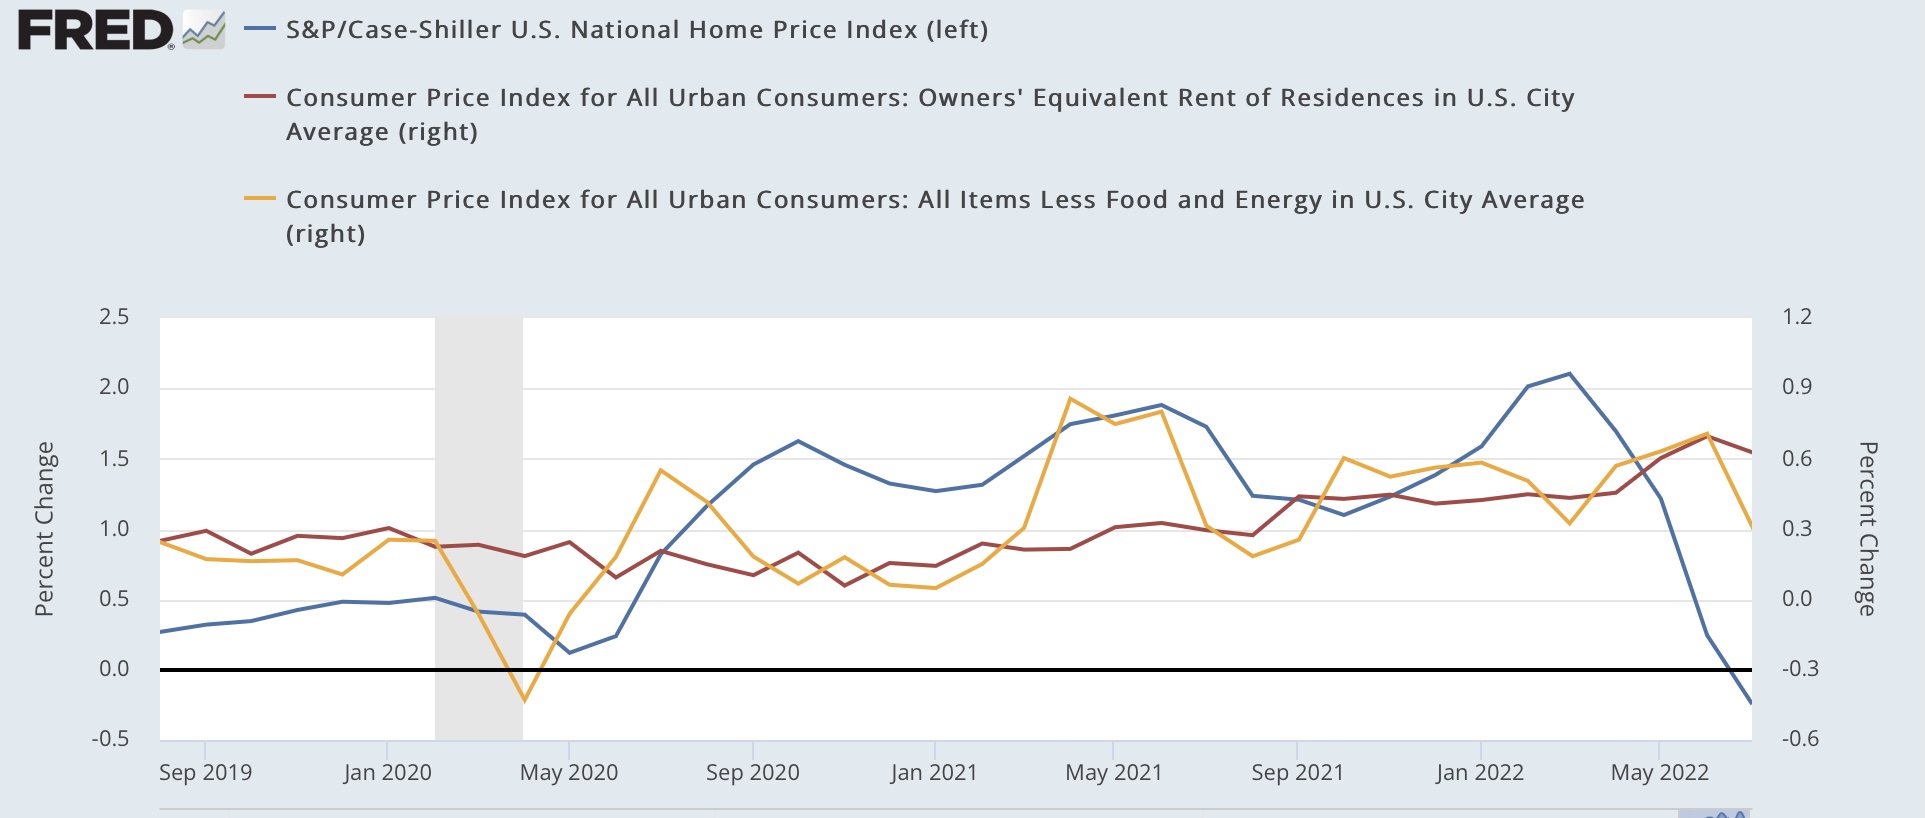
Rent + owner’s equivalent rent are 40% of core inflation. Unsurprisingly, core inflation tends to track similarly to OER. But between May 2021 and May 2022, OER only averaged +0.4% monthly, whereas the Case Shiller index increased 1.5% on average monthly. If 40% of core inflation increased at 1.5% monthly instead of 0.4% monthly, core inflation would have on average been +0.4% higher each month for that entire year.
In other words, the Fed would have had a much earlier warning that an upsurge in core inflation was not going to be “transitory.”
By contrast, during the last 3 months of the period through July that we have house price index data, OER has averaged +0.4%, whereas house prices have increased on average +0.6%. This would have brought core inflation down by -0.1% each month. If we use the last two months, OER is +0.6% and house prices have been unchanged. Core inflation would have been -0.3% lower in June and July.
In fact, if the trend of the last several months continues, by year end OER is going to be higher than house price appreciation on a YoY as well as m/m basis. And while OER has been increasing, house price indexes have been decelerating.
In other words, if the Fed keeps raising rates, it is most likely chasing a phantom menace, a lagging indicator the leading measures for which will have already peaked and come down sharply.
Interest rates are not high. They are still low. It’s just that people have become accustomed to free money or near zero interest rates. Heck, some countries have even gone negative! Look at it this way. If you are poor and have only 1$ to your name and I give you another dollar, your “fortune” has just gone up by 100% in an instant! So stop whining about being poor, right?
The Fed has ignored inflation for decades and especially over the recent twenty years as it struggled to keep asset bubbles perky and wages low. The rise in interest rates really needs to redress the excesses of thirty years rather than a slowing rate of inflation. Homes are still unaffordable. The stock market is still in a bubble despite the recent small move down.
People whining about “high” rates point to the stock market (OMG, do you realize how much money all those billionaires just lost!!!) or housing affordability. Well, if you use spot mortgage interest rates and spot house prices, then, yeah, houses are now even less affordable…that is the point of the exercise. So people stop buying houses at 4-7 times median income. House prices fall and become affordable again. Meanwhile with inflation running at even 2%, interest rates need to be over that to justify lending risk.
Economics have been shattered since 2001 as the Fed has galloped to the rescue of any bubble and every market it can affect. It’s sad to see so much whining from all quarters about how suddenly the Fed is not continuing to make the rich even richer!