Distibution and Total Growth of Family Wealth
This popped up on “Letters from an American” just last night. I was too tired to read Prof. Heather Cox-Richardson’s article. So, I missed out on a good message about the income of America’s population. This is a recent commentary by the not-so nonpartisan Congressional Budget Office in September 2022. The thrust of the article? “Trends in the Distribution of Family Wealth, 1989 to 2019.”
Prof. Heather Cox-Richardson’s Introduction;
Since the 1980s, the argument for dismantling the government has been that federal regulations hamper the operation of the free market, thus slowing economic growth, while the taxes required to maintain a bureaucratic system take money away from those who otherwise would invest in businesses. The avowed theory is that a freely operating market will free up money on the “supply side” of the economy. Flush with cash, investors will theoretically pump that money into new enterprises that will hire workers, and everyone will prosper together.
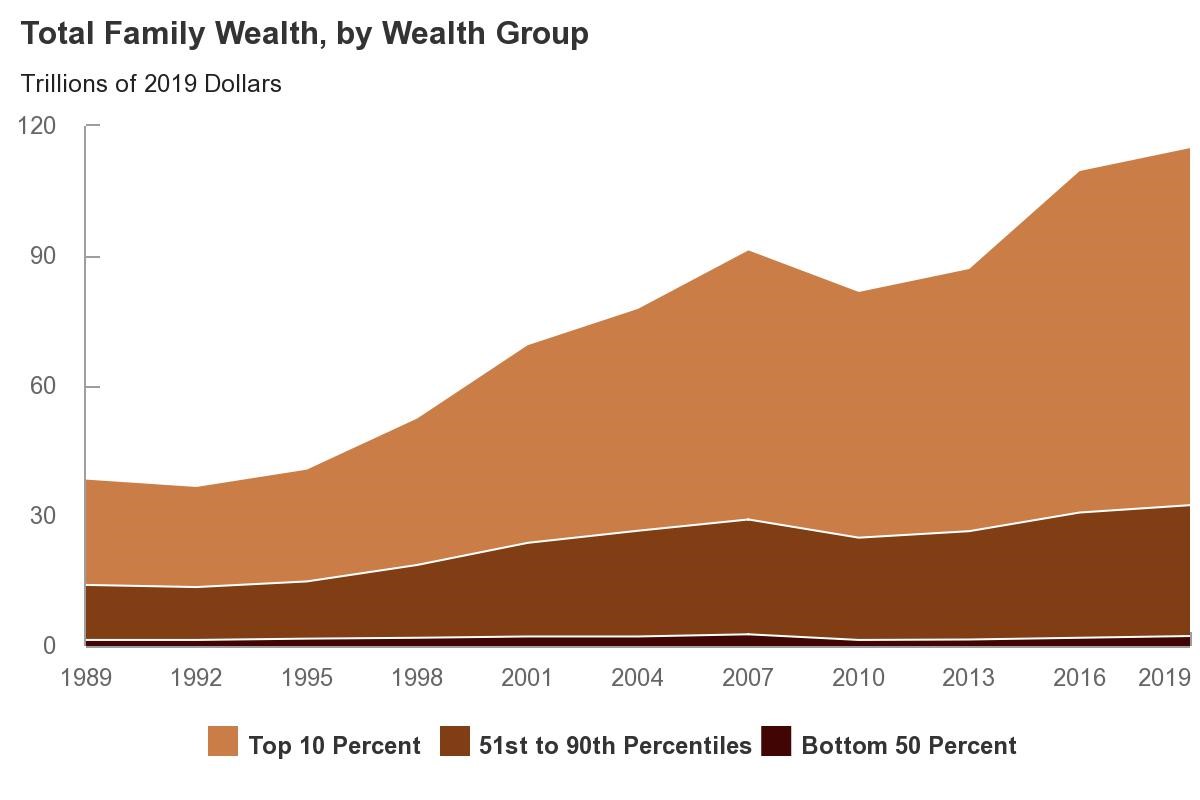
Yesterday the Congressional Budget Office released a study of trends in the distribution of family wealth between 1989—immediately after President Ronald Reagan began the antiregulation and antitax push—and 2019. In those thirty years, total real wealth held by families tripled from $38 trillion to $115 trillion. But the distribution of that growth was not even.
Money moved toward the families in the top 10%, and especially in the top 1%, shifting from families with less income and education toward those with more wealth and education. This concentration of wealth mirrors trends seen in industries like gambling, where casinos not in the UK have grown significantly, attracting international players and high rollers while leaving smaller, local operations struggling to compete. In the 30 years examined, the share of wealth belonging to families in the top 10% increased from 63% in 1989 to 72% in 2019, from $24.3 trillion to $82.4 trillion (an increase of 240%). Similarly, the share of total wealth held by families in the top 1% rose from 27% to 34% in the same period. In 2019, families in the bottom half of the economy held only 2% of the national wealth, and those in the bottom quarter owed about $11,000 more than they owned.
The relative invisibility of these statistics after forty years under Republican ideology has enabled today’s Republicans to insist the Democrats are “socialists” who are trying to redistribute wealth downward even as our laws are clearly redistributing it upward.
A Little More Detail
• Total Wealth. Total real wealth (adjusted to remove the effects of inflation) held by families in the United States tripled from 1989 to 2019. It increased from $38 trillion in 2019 dollars (roughly four times the nation’s gross domestic product, or GDP) to $115 trillion (about five times GDP).
• Concentration of Wealth. The growth of real wealth over the past three decades was not uniform: Family wealth increased more in the top half of the distribution than in the bottom half. Families in the top 10 percent and in the top 1 percent of the distribution saw their share of total wealth rise over the period. In 2019, families in the top 10 percent of the distribution held 72 percent of total wealth. Families in the top 1 percent of the distribution held more than one-third; families in the bottom half of the distribution held only 2 percent of total wealth.
• Trends by Family Characteristics. Over the 30-year period, the median wealth of families in higher-income groups rose. Families with more education and older families rose faster than that of families with less income, families with less education, and younger families. The median wealth of White families exceeded that of families in other racial and ethnic groups by considerable amounts throughout the period. The median wealth of every cohort born since 1950 was less than the preceding cohort’s median wealth when that cohort was the same age.
• Trends Since 2019. In the first quarter of 2020, total family wealth declined as a result of the disruption in economic activities caused by the coronavirus pandemic. By the end of the second quarter of 2020, total family wealth had recovered; it continued to increase through the fourth quarter of 2021 but declined slightly in the first quarter of 2022
Distibution of Family Wealth

Over the 1989–2019 period, family wealth increased more rapidly at the 90th and 75th percentiles of the wealth
distribution than it did at the 50th and 25th percentiles. Measured in 2019 dollars, family wealth rose by 87 percent at
the 90th percentile, by 71 percent at the 75th percentile, by 40 percent at the 50th percentile, and by 17 percent at the
25th percentile of the distribution.
The differential growth of family wealth at the selected percentiles of the distribution is partly attributable to differences in growth rates after the 2007–2009 recession. From 2007 to 2010, wealth declined the most at the 25th and 50th percentiles—by 42 percent and 32 percent, respectively. Wealth also fell at the 75th percentile—by 15 percent—but at the 90th percentile, wealth increased by 4 percent. The recovery followed a similar pattern. Family wealth at the 25th and 50th percentiles still had not fully recovered in 2019: It was 26 percent and 10 percent less, respectively, than it had been in 2007. By contrast, family wealth at the 75th percentile was the same in 2019 as it had been in 2007, and wealth at the 90th percentile was 15 percent greater than it had been before the recession.
There is more data in this CBO report. What I pulled out and what Prof. Heather revealed is a great deal of difference in who the economy favored based upon political policy.
“Trends in the Distribution of Family Wealth, 1989 to 2019″ (cbo.gov)
“September 28, 2022,” Letters from an American, Prof. Heather Cox Richardson, (substack.com)
“A family is defined by the survey as the primary economic unit in a household; it consists of a single person or a couple and all other people in the household who are financially interdependent with that person or couple.”
“The Congressional Budget Office analyzed the relationship between family wealth and five such characteristics—income, education, race and ethnicity, age, and birth cohort.”
“The characteristics of the various cohorts differ. For example, by age 35, people born between 1980 and 1984 received more years of education than earlier generations, and a smaller percentage of them were married. In addition, a smaller percentage of families in that cohort than in older cohorts identified as White. How such differences in characteristics affect the distribution of family wealth within generations is outside the scope of this report.”
Two factors that I am aware of from my reading of SS reports would lead me to predict that wealth would concentrate even if the rules were not controlled by the wealthy. People are living longer and are having smaller families. “Successful” families have longer to grow wealth (a factor discussed but “out of scope”), and fewer heirs among which to divide the spoils of that success.
The role of inheritance in the concentration of wealth was also apparently out of scope.
I am “elite” enough to know the economic definition of socialism, and know that I am not a socialist, but I do believe that the ability to become wealthy by being a successful capitalist depends on a social structure that has healthy, educated workers that can buy stuff. Policies that are called “socialist” will benefit capitalists by making the structure stronger.
I get the impression that supply side economics doesn’t work, but that demand side economics works but it is socialism.
Isn’t it the advice of successful business people to find an unfulfilled need and fill it?
Arne
yes, the “data” were a little hard to make sense of since relevant factors were not controlled for. but in general I think the “facts” are about right.
one thing, just to get my minimum adult requirement of hate today, is that nothing in the data
argue against the possibility that acumulating wealth is a product of good genes and/or hard work. in fact I don’t agree with that hypothesis, and even if it were true I think Kaleberg’s point (above) is well taken. But it turns out the rich can steal enough “wealth” to keep themselves happy, mostly by buying power…which means keeping the poor poor.
Meanwhile Mr Putin thinks the world’s poor…or at least poor countries…will be better off if he launches a nuclear war.