Trade Deficit Rose on Imports of Industrial Supplies, Materials and Consumer Goods
RJS, MarketWatch 666
Summary: Trade Deficit Rose 22.3% to Record High in March on Higher Imports of Industrial Supplies & Materials and Consumer Goods
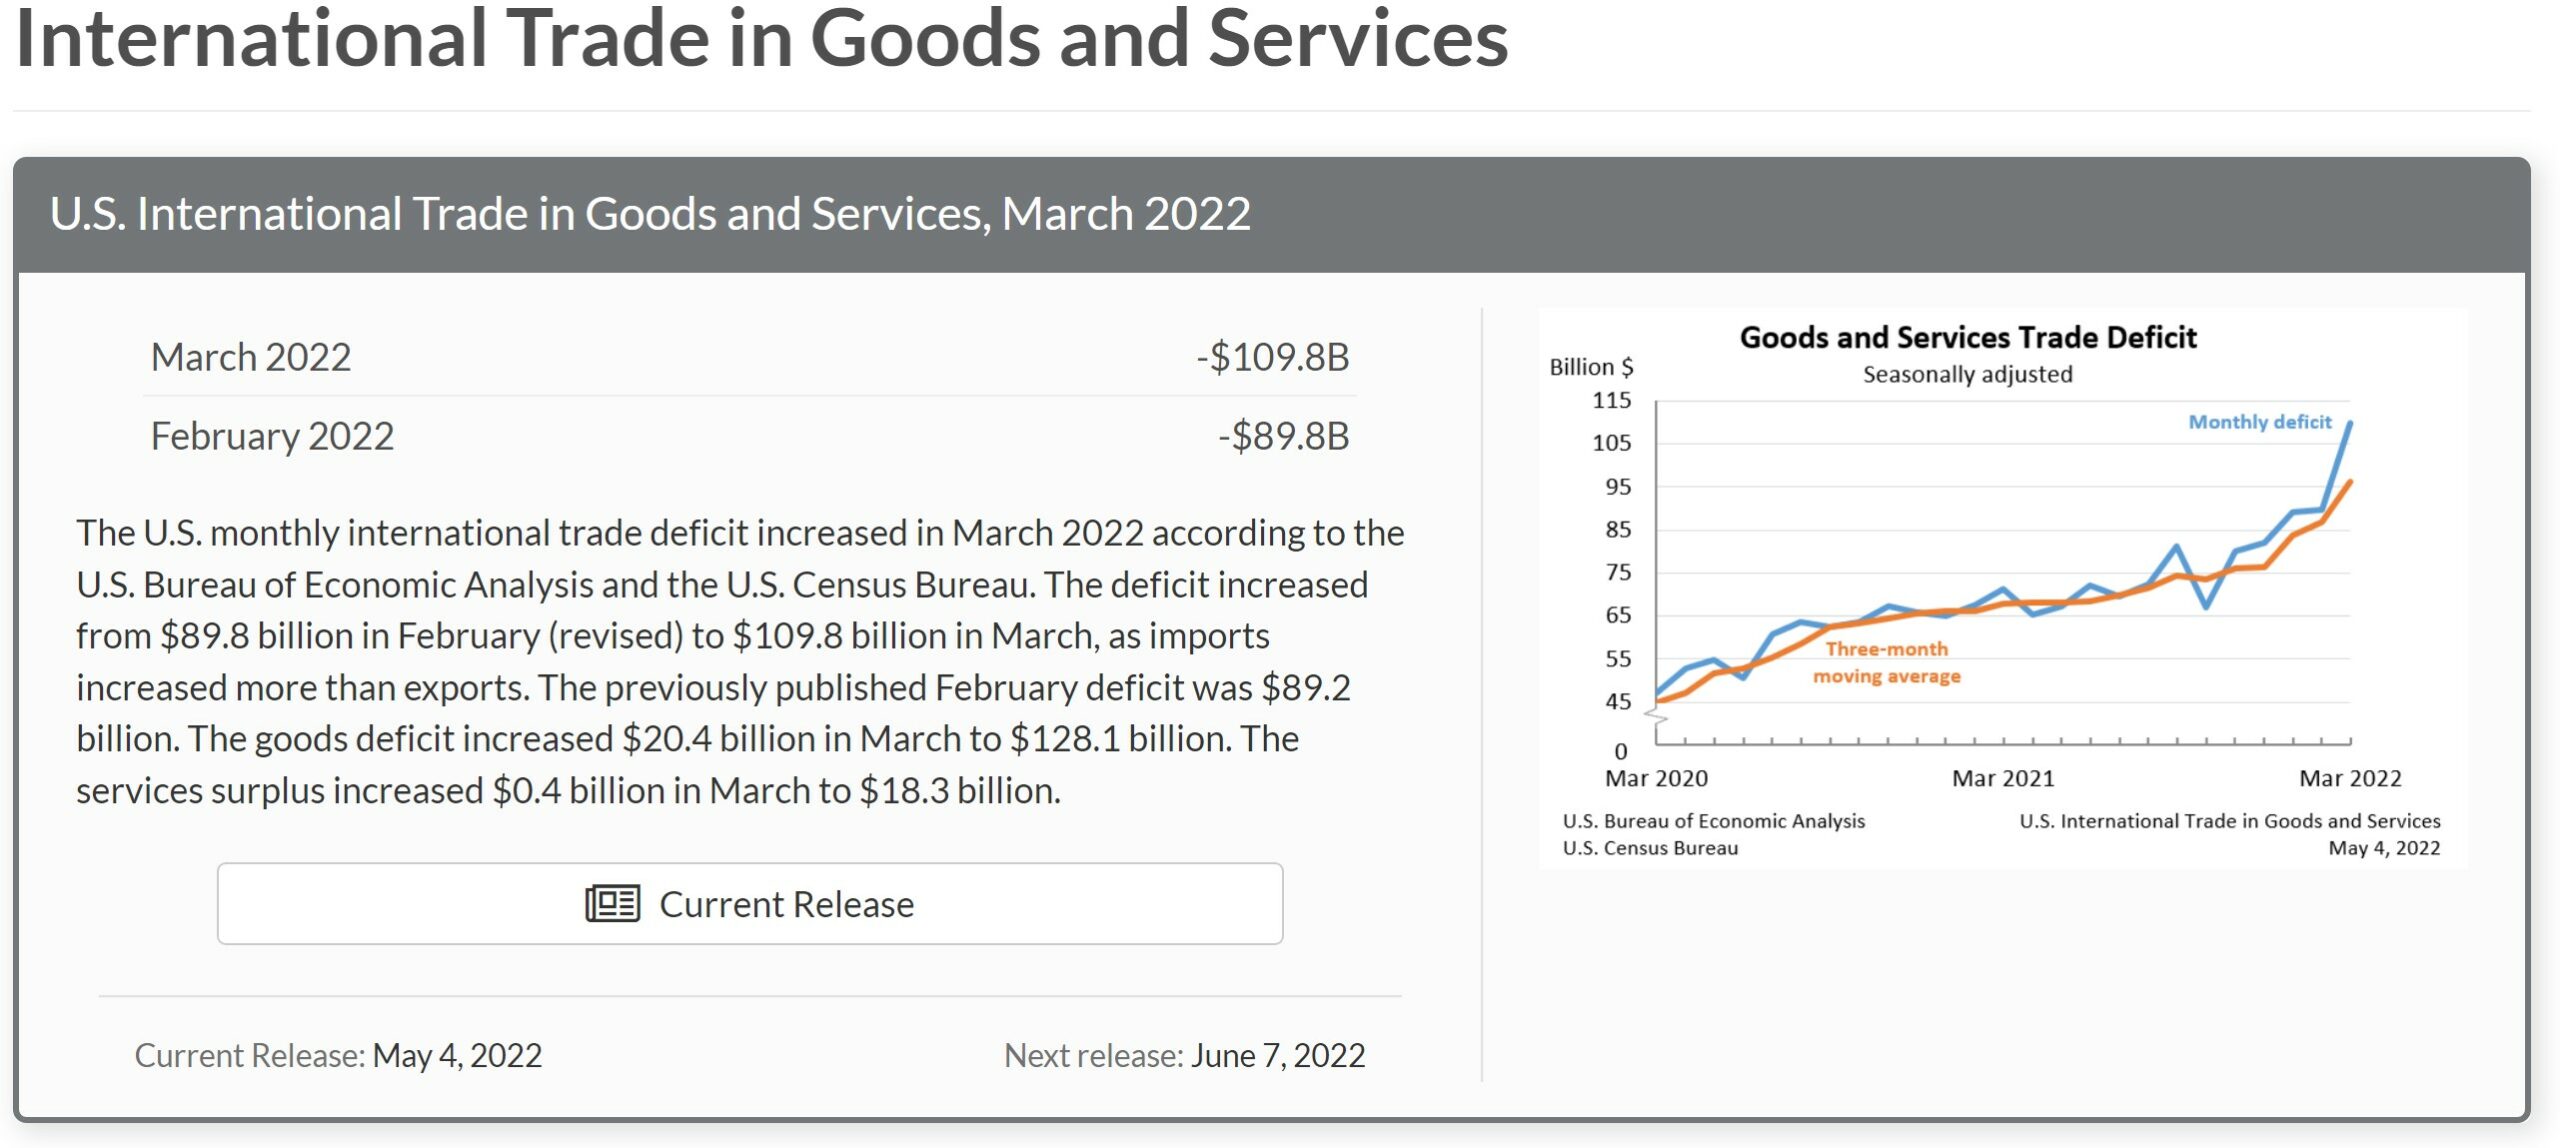
Our trade deficit was at another record high in March, 22.3% higher than February’s record, as both our imports and exports increased, but our imports increased by quite a bit more . . . the Commerce Department’s report on our international trade in goods and services for March indicated that our seasonally adjusted goods and services trade deficit rose by $20.0 billion to $109.8 billion in March, from a February deficit that was revised from the originally reported record $89.2 billion to a record $89.8 billion . . . in rounded totals, the value of our March exports rose by $12.9 billion to $241.7 billion on a $11.6 billion increase to $170.7 billion in our exports of goods and a $1.2 billion increase to $71.1 billion in our exports of services, while our imports rose $32.9 billion to $351.5 billion, on a $32.0 billion increase to $298.8 billion in our imports of goods and a $0.9 billion increase to $52.7 billion in our imports of services . . . export prices averaged 4.5% higher in March, which means the relative real increase in exports for the month was less than the nominal increase by that percentage, while import prices averaged 2.6% higher, meaning the increase in real imports was smaller than the nominal dollar increase reported here by that percentage….
Our March exports of goods were higher largely due to greater exports of industrial supplies and materials and of automotive vehicles, parts, and engines, even as every end use category of our exports increased . . . referencing the Full Release and Tables for March (pdf), in Exhibit 7 we find that our exports of industrial supplies and materials rose by $7,413 million to $67,289 million on a $1,994 million increase in our exports of petroleum products other than fuel oil, a $1,734 million increase in our exports of crude oil, a $1,325 million increase in our exports of fuel oil, a $1,079 million increase in our exports of natural gas liquids, and a $377 million increase in our exports of precious metals other than gold, a $494 million increase in our exports of petroleum products other than fuel oil, and a $439 million increase in our exports of natural gas liquids, and that our exports of automotive vehicles, parts, and engines rose by $1006 million to $13,062 million on a $493 million increase in our exports of passenger cars, and a $286 million increase in our exports of trucks, buses, and special purpose vehicles . . . In addition, our exports of foods, feeds and beverages rose by $799 million to $15,547 million on a $436 million increase in our exports of soybeans, our exports of capital goods rose by $689 million to $46,116 million, led by a $312 million increase in our exports of electric apparatuses, our exports of consumer goods rose by $422 million to $20,667 million on a $276 million increase in our exports of jewelry, and our exports of other goods not categorized by end use rose by $704 million to $6,511 million….
Exhibit 8 in the Full Release and Tables gives us seasonally adjusted details on our goods imports and shows that rising imports of industrial supplies, materials and equipment, consumer goods, capital goods, and automotive vehicles, parts, and engines were responsible for most of the March increase in imports . . . In California, safety codes are different for rolling ladders and others industrial equipment. For example, you will need a CAL-OSHA rolling ladder that meets CAL-OSHA requirements.
Our imports of industrial supplies and materials rose by $11,323 million to $76,377 million on a $6,806 million increase in our imports of finished metal shapes, a $1,189 million increase in our imports of crude oil, an $893 million increase in our imports of nonmonetary gold, a $501 million increase in our imports of organic chemicals, a $352 million increase in our imports of industrial supplies other than those itemized, and a $325 million increase of in our imports of shingles and wallboard, which were slightly offset by a $953 million decrease in our imports of “other” chemicals, while our imports of consumer goods rose by $9,952 million to $83,060 million on a $2,030 million increase in our imports of apparel and textiles other than those of wool or cotton, a $1,360 million increase in our imports of cotton apparel and household goods, a $1,303 million increase in our imports of footwear, a $1,302 million increase in our imports of furniture and related household goods, an $1,142 million increase in our imports of toys, games and sporting goods, a $669 million increase in our imports of pharmaceuticals, a $558 million increase in our imports of household appliances, a $378 million increase in our imports of cookware, cutlery, and kitchen tools, a $373 million increase in our imports of camping apparel and gear, and a $338 million increase in our imports of “other consumer nondurables”, which in turn were slightly offset by a $761 million decrease in our imports of gem diamonds . . . meanwhile, our imports of capital goods rose by $1,532 million to $75,092 million on a $1,532 million increase in our imports of computers, a $1,327 million increase in our imports of computer accessories, a $562 million increase in our imports of tele-communications equipment, a $539 million increase in our imports of drilling & oilfield equipment, a $341 million increase in our imports of electric apparatuses, and a $300 million increase in our imports of medical equipment, and our imports of automotive vehicles, parts and engines rose by $3175 million to $32,824 million on a $2,520 million increase in our imports of passenger cars and $731 million increase in our imports of vehicle parts and accessories other than engines, chassis and tires . . . in addition, our imports of foods, feeds, and beverages rose by $1,052 million to $17,610 million on increases in most food and feed items, and our imports of other goods not categorized by end use rose by $734 million to $11,346 million…
The press release for this month’s report summarizes Exhibit 19 in the full release pdf for March, which gives us surplus and deficit details on our goods trade with selected countries:
The March figures show surpluses, in billions of dollars, with South and Central America ($6.7), Hong Kong ($1.3), Brazil ($1.2), and United Kingdom ($0.5). Deficits were recorded, in billions of dollars, with China ($48.6), European Union ($15.6), Mexico ($10.6), Canada ($10.3), Germany ($6.2), Japan ($6.1), Taiwan ($4.9), Italy ($3.4), India ($3.2), South Korea ($3.1), Saudi Arabia ($1.0), France ($0.8), and Singapore ($0.1).
- The deficit with China increased $7.4 billion to $48.6 billion in March. Exports decreased $0.1 billion to $12.9 billion and imports increased $7.3 billion to $61.5 billion.
- The deficit with Canada increased $3.7 billion to $10.3 billion in March. Exports increased $1.8 billion to $29.1 billion and imports increased $5.5 billion to $39.4 billion.
- The deficit with the European Union decreased $1.3 billion to $15.6 billion in March. Exports increased $2.2 billion to $28.4 billion and imports increased $0.8 billion to $44.0 billion.
In the advance estimate of 1st quarter GDP published last week, our March trade deficit in goods was estimated based on the sketchy Advance Report on our International Trade in Goods, which was released the day before the GDP release . . . that report estimated that our seasonally adjusted March goods trade deficit was at $125,324 million on a Census basis, on goods exports of $169,309 million and goods imports of $294,633 million . . . this report revises that advance and shows that our actual Census basis goods trade deficit in March was at $127,117 million, on adjusted goods exports of $169,192 million and adjusted goods imports of $296,309 million . . . at the same time, the February goods trade deficit was revised from the $106,345 million indicated in that advance report to $106,674 million . . . combined, those revisions from the previously published figures indicate that the nominal trade in goods deficit used in the first quarter GDP report was $2,122 million too low, which work out to be around $8.5 billion short on an annualized basis . . . in the advance GDP report, a $8.5 billion nominal change in goods trade worked out to a $8.4 change in inflation adjusted goods trade, and hence the revision to our trade in goods indicated by this report would indicate a 0.13 percentage point subtraction from 1st quarter GDP when the 2nd estimate is released at the end of May
however, for services, the BEA’s Key source data and assumptions (xls) for the advance estimate of first quarter GDP provides aggregate exports and imports of services at annual rates on an international-transactions-accounts basis, indicating that the BEA assumed a $12.6 billion increase in exports of services and a $10.1 billion increase in imports of services in March on that basis . . . while there is no comparable annualized metric or adjusted data in this report that we could match that to, this release does show that exports of services rose $1.25 billion in March after February exports of services were revised $0.04 billion lower, and that imports of services rose $0.9 billion in March after February imports of services were revised $0.27 billion higher . . . that suggests that the annual rate for March exports of services used in the GDP report was on the order of $2 billion too low, while the annual rate for March imports of services used in the GDP report was about $4 billion too low…revising those annualized figures, and annualizing the monthly services trade revisions for February vis a vis those reported, the annual rate for 1st quarter services exports would be revised about $2.5 billion higher, while the annual rate for 1st quarter services imports would be revised about $7 billion higher…the resulting upward revision of ~$4.5 billion to our total services deficit would be enough to subtract about 0.08 percentage points from 1st quarter GDP, with a caveat based on our rough conversion of monthly figures in this report to the annualized figure used in national accounts…