Nat Gas Up, SPR, Oil, Distillates, Product supply Low
RJS, Focus on Fracking
__________
Summary: Natural gas price hits 164 month high after doubling in 2 months; SPR at a 1058 week low, total US oil supplies at a 746 week low; distillates supplies at a 729 week low, total oil + products inventories at a 711 week low, gasoline imports at a 8 month high; natural gas rigs at a 31 month high..
___________
Natural gas prices hit 164 month high after doubling in 2 months
Oil prices rose for the third time in four weeks after the EU advanced a plan to phase out imports of Russian oil . . . after rising 2.6% to $104.69 a barrel last week as fears of lower supplies from Russia outweighed concerns about reduced demand from China, the contract price for US light sweet crude for June delivery opened lower and tumbled more than 3% early Monday on forecasts of weak economic growth in China following restrictive lockdowns of millions in Shanghai, and as the U.S. dollar rallied ahead of this week’s Fed meeting, when a half point interest rate hike was expected, but bounced off the $100 a barrel level to rally late and finish trading 48 cents higher at $105.17 a barrel, triggered by reports that OPEC was only able to raise their output a little over 40,000 bpd, with their production shortfall growing to 200,000 bpd last month . . . but oil prices slipped out of the gate again on Tuesday, as demand worries stemming from China’s prolonged COVID-19 lockdowns outweighed the prospect of a European embargo on Russian crude, and their losses accelerated in afternoon trading as traders positioned ahead of the weekly release of U.S. inventory data, and the likelihood for the biggest Fed rate hike since at least 2000, and settled $2.76 lower at $102.41 a barrel . . . however, oil prices jumped 3% in Asian trading on Wednesday after the American Petroleum Institute reported a larger-than-anticipated draw from US oil supplies and after the EU spelled out plans to phase out their imports of Russian oil, and then accelerated higher in afternoon trading, sending both major crude benchmarks 5% higher, after the Fed raised interest rates half a percent and the EIA reported a much larger-than-expected drop in domestic fuel stocks due to higher demand for gasoline and diesel, as front month oil prices settled $5.40 higher at $107.81 a barrel…oil continued higher in early trade Thursday, after the OPEC and Russian-led cartel agreed on a small, incremental production increase in June, sticking to their earlier plan, despite the European Union’s decision to embargo Russian oil, and then jumped 3% to over $111, after CNN leaked news of the administration’s “long-term buyback plan” to partially refill the SPR, before paring its gains amid a 5% stock market selloff, as traders reassessed the risk that the Fed’s aggressive interest rate hikes would tilt the U.S. economy into a recession, with oil closing just 45 cents higher at $108.26 a barrel . . . oil climbed for the third straight session during mid-morning Asian trade on Friday, erasing earlier losses, as concerns lingered over the prospect of tighter supplies after the EU’s embargo on Russian oil, and closed the week at a six week high of $109.77 a barrel, $1.51 higher on the day, as impending sanctions on Russian oil raised the prospect of tighter supply and had traders shrugging off worries about global economic growth . . . oil prices thus ended 4.9% higher on the week, with energy traders completely fixated on the looming European sanctions on Russian oil, and none willing to be on the wrong side of a major crude supply disruption…
Meanwhile, natural gas prices rose for the seventh time in eight weeks and traded at their highest price levels since 2008 all week, as cold weather turned hot, leading to early demand for cooling . . . after rising 8.7% to $7.244 per MMBtu last week after Russia began to cut off gas supplies to European countries for nonpayment, the contract price of natural gas for June delivery opened 2% higher on Monday as domestic supply remained constrained by sluggish production and an enduring inventory deficit, and closed 23.1 cents higher at $7.475 per MMBtu, on forecasts of warmer-than-usual weather for the next two weeks, which would increase cooling demand and keep storage injections lower than normal during the season for the greatest inventory builds . . . natural gas prices then surged 9% to their highest level since 2008 on Tuesday, as fallout from the Ukraine war wreaked havoc on global energy markets, but backed off the $8 level to end 47.9 cents higher at $7.954 per MMBtu . . . but natural gas prices shot right past $8 early Wednesday, as inventory concerns mounted ahead of a summer that promised high demand, and settled 46.1 cents higher at $8.415 per MMBtu, with underwhelming gas production, tight U.S. supplies, and forecasts for hot conditions across Texas and surrounding states into early next week seen as the primary drivers of spiking natural gas prices . . . natural gas prices rallied to their 3rd consecutive 13 year high on Thursday, and approached the $9 level, before settling with a 36.8 cent increase at $8.783 per MMBtu, as hot spring weather boosted air conditioning demand, while much higher global prices kept demand for LNG exports strong . . . however, after pushing to a hair below $9 at $8.996 early on Friday, natural gas prices tumbled 74.0 cents or more than 8% to $8.043 per mmBTU, as traders took profits on forecasts for a rise in output, milder weather and a drop in demand for the next two weeks . . . natural gas prices still ended 11% higher on the week, and remained at a level more than double that at the beginning of this year, which is fairly evident in the daily price graph we have included below…
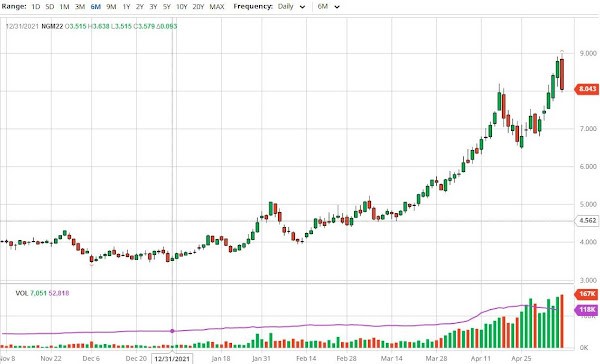
To the left is a screenshot (click on chart to enlarge) of the interactive natural gas price chart from barchart.com, which I have reset to show daily natural gas prices over the past 6 months . . . this same chart can be reset to show prices of front month or individual monthly natural gas futures contracts over time periods ranging from 1 day to 30 years, as the menu bar on the top indicates, and also to show natural gas prices by the minute, hour, day, week or month for each…each bar in the graph above represents the range of natural gas prices for a single day, with days when prices rose indicated in green, and days when prices fell indicated in red, with the small sticks above or below each daily bar representing the extent of the price change above or below the opening and closing price for the day in question . . . likewise, the bars across the bottom show trading volume for the days in question, again with up days indicated by green bars and down days indicated in red . . . you’ll note that by positioning our cursor over December 31st, indicated by a thin vertical line, we have caused that day’s natural gas prices to be displayed in green in the upper left corner of the graph . . . there we can see that natural gas prices closed at $3.579/mm BTU on that date, clearly less than half of any price seen this week . . . in fact, we can also see that natural gas traded below $4 on February 11th, so gas prices have more than doubled in less than two months..
The EIA’s natural gas storage report for the week ending April 29th indicated that the amount of working natural gas held in underground storage in the US rose by 77 billion cubic feet to 1,567 billion cubic feet by the end of the week, which still left our gas supplies 382 billion cubic feet, or 19.6% below the 1,949 billion cubic feet that were in storage on April 29th of last year, and 306 billion cubic feet, or 16.3% below the five-year average of 1,873 billion cubic feet of natural gas that have been in storage as of the 29th of April over the most recent five years . . . the 77 billion cubic foot injection into US natural gas working storage for the cited week was 16 billion cubic feet more than the average forecast for a 61 billion cubic foot injection from an S&P Global Platts survey of analysts, but it was close to the average injection of 78 billion cubic feet of natural gas that have typically been added to our natural gas storage during the same week over the past 5 years, while it was well more than the 54 billion cubic feet that were added to natural gas storage during the corresponding week of 2021…
Seems like it’s a toss up between rising energy prices and rising interest rates that will lead to recesssion soon…
Mike:
Which interest rates?
This is the other problem everyone’s worried about
https://www.npr.org/2022/05/04/1096111642/federal-reserve-interest-rates-inflation-prices#:~:text=Fed%20policymakers%20said%20in%20March,by%20the%20end%20of%202023.
Mike:
You did not answer the question I posed. Who (institute?) are we talking about here?
Is this what you’re asking about?
https://www.reuters.com/business/finance/jpmorgan-raises-prime-rate-after-feds-interest-rate-move-2022-05-04/
Mike:
You should tell RJS and myself, what “you” think. I can find, access, and read the other stuff myself. I am interested in what you think. Most of us are professionals or econ. Profs. We might not agree with you and then again, we may. I am supply chain oriented internationally and for decades. You know what RJS writes about oil, natural gas, gasoline, energy, etc.
run7541
You should be clear in your question then. My main point was, the Fed’s efforts to stem inflation with rate tightening would be offset by oil and gas supply scarcity, which is caused by geopolitical factors not within their control. So we can expect these twin problems to greatly dampen demand, and most affected will likely be small businesses and the most indebted consumers. Unless oil supply miraculously recovers, this leads to populist discontent and will be a major headwind for the current Administration in the next election.
Mike:
Much of what the FED is doing will have little impact. It will not fix the supply chain issues. As RJS will tell you, Biden can not control oil an gasoline pricing, If you wish to help with gasoline supply, slow down and do the speed limit. Read New Deal democrats last couple posts, we are at the edge right now of a slow down and well before the FED did anything.
The FED is whacking the peasants just like Voelker did because it is easy to do.
run75441
In your field of supply chain, I’m sure you can imagine how miuch this will disrupt the growth of online commerce, which depends a lot on affordable last mile delivery. Many Uber drivers will likely stop service.
Mike:
And a fringe is plotting against the USPS which goes “everywhere” DHL, FEDX, UPS, and Uber drivers do not want to or can not go. And typically for less money. Where are you Mike? In the US>
run75441
I’m in the Philippies, a country that catches cold when America sneezes. Oil inflation will be worse here since oil barrels are priced in an appreciating USD. And our Central Bank will be forced to follow Fed rate hikes, otherwise money will flee to USD, further worsening the USD-Peso exchange rate.
Mike:
I thought you were in the Philippines. Great people who were always nice to me. I remember the little busses and the people piling on to them and going to work.
I worked at Yazaki and been to the Philippines a number of times to visit the EMI plant (volcano behind it?). I would go to Cebu and call on IWG wire also. We would get wire from IWG.
The US does make it hard for other countries. This increase is not needed. We will go into recession anyways. Prices are outstripping wages.
Mike, you are welcome here.
Thanks, always glad to know people from around the world who’ve been here. It looks like it’s going to be 1970’s-style economic conditions again, with stagflation worldwide. Furthering the deja vu here is a Marcos will be in power.
Mike:
Reading New Deal Democrat is a good idea too.
the Fed has already commuted to 7 rate hikes this year – one at each remaining meeting….i’m sure you can check, but i can’t recall a Fed rate hike cycle that hasn’t resulted in a recession…
then we have ongoing supply chain issues from the lockdowns in China, and shortages of materials stemming from the war in the Ukraine…
meanwhile, diesel fuel hit a record $5.623 a gallon yesterday, & gasoline prices hit $4.374 a gallon…