GDP Shrunk, Record Trade Deficit, and Slower Growth of Inventories
RJS, MarketWatch 666
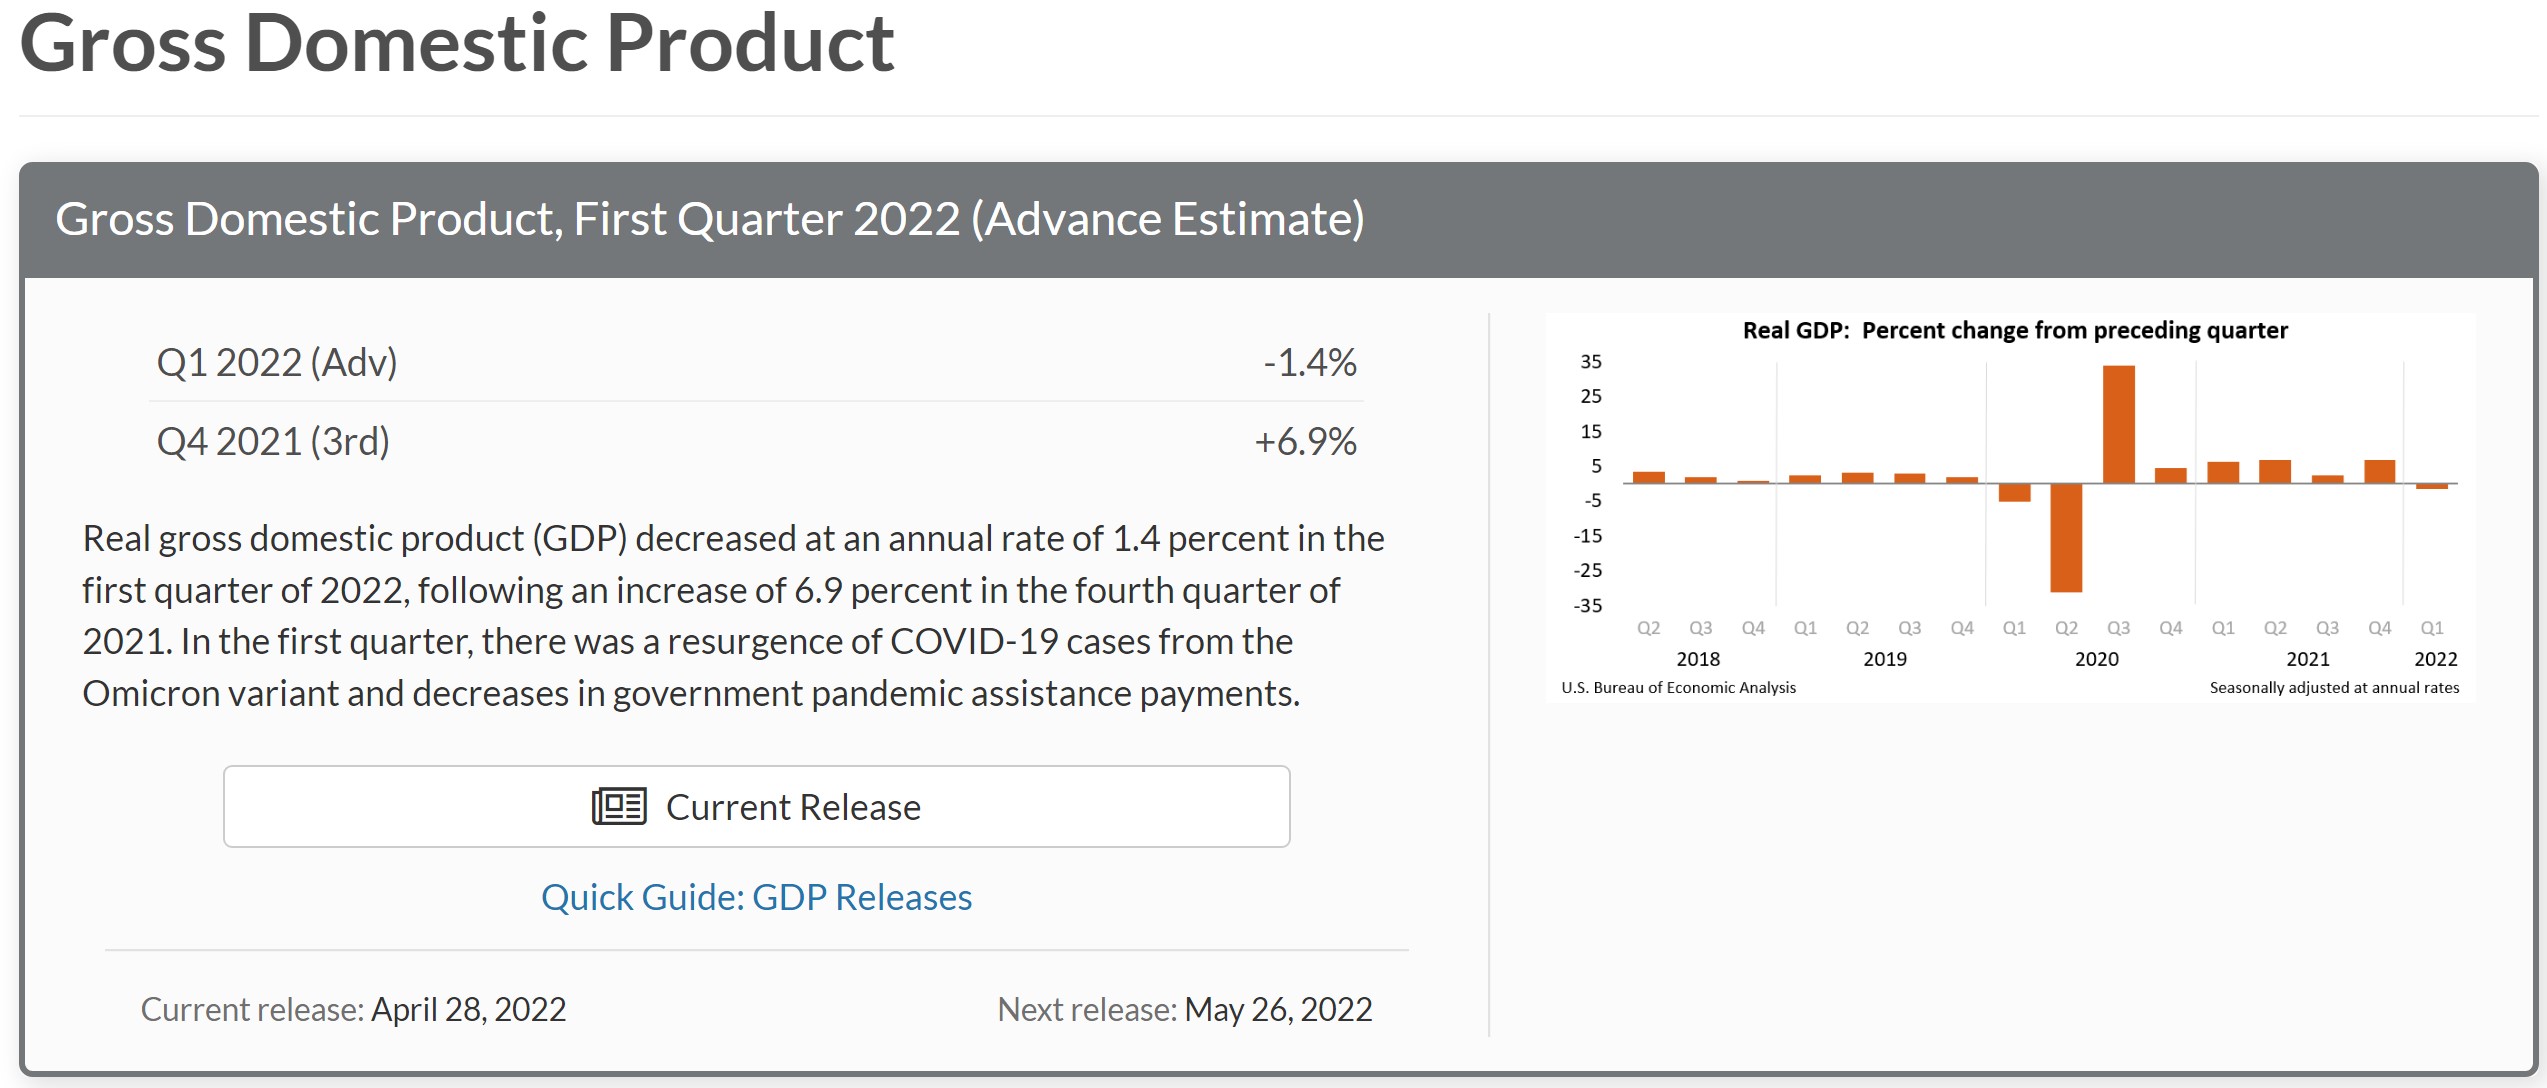
1st Quarter GDP Shrunk at a 1.4% Rate on a Record Trade Deficit and Slower Growth of Inventories
Our economy shrunk at a 1.4% rate in the 1st quarter, the first GDP reversal since the first quarter of 2020, as increased personal consumption of services and greater fixed investment were more than offset by weaker investment in inventories and a record trade deficit, which subtracted over 3 percent from GDP . . . the Advance Estimate of 1st Quarter GDP from the Bureau of Economic Analysis estimated that the real output of goods and services produced in the US contracted at a 1.4% annual rate from the output of the 4th quarter of 2021, when our real output grew at a 6.9% real rate . . . in current dollars, our first quarter GDP grew at a 6.48% annual rate, increasing from what would work out to be a $24,002.8 billion a year output rate in the 4th quarter of last year to a $24,382.7 billion annual rate in the 1st quarter of this year, with the headline 1.4% annualized rate of decrease in real output arrived at after an annualized inflation adjustment averaging inflation adjustment averaging 8.0%, aka the GDP deflator, was computed from the price changes of the components and applied to their current dollar change.
As is usual with an advance estimate, the BEA cautions that the source data is incomplete and also subject to revisions, which have averaged +/-0.6% in either direction before the third estimate for the quarter is released, which will be two months from now . . . note that March construction, March trade in services, and non-durables inventory data have yet to be reported, and that the BEA assumed a $12.6 billion increase in exports of services, a $10.1 billion increase in imports of services, a $10.0 billion increase in residential construction, a $5.5 billion increase in non-residential construction, a $0.5 billion increase in public construction, and a $6.5 billion increase in nondurable manufacturing inventories for March before they estimated 1st quarter output (see the Key source data and assumptions excel file that accompanies this report for more specific details)..
While we cover the details on the 1st quarter below, remember that the news release for the Advance Estimate reports all quarter over quarter percentage changes at an annual rate, which means that they’re expressed as a change a bit over four times of that what actually occurred over the 3 month period, and that the prefix “real” is used to indicate that each change has been adjusted for inflation using price indexes chained from 2012 prices, and then that all percentage changes in this report are calculated from those ‘2012 dollar’ figures, which would be better thought of as a quantity indexes than as any reality based dollar amounts, because the change in real GDP is not a monetary metric . . . for our purposes, all the data that we’ll use in reporting the changes here comes directly from the pdf for the advance estimate of 1st quarter GDP, which we find on the BEA’s GDP landing page, where you can also find links to just the tables on Excel and other technical notes . . . specifically, we refer to table 1, which shows the real percentage change in each of the GDP components annually and quarterly since the 2nd quarter of 2018, table 2, which shows the contribution of each of the components to the GDP growth figures for those quarters and years, table 3, which shows both the current dollar value and the inflation adjusted value in 2012 dollars of each of those components, and table 4, which shows the change in the price indexes for each of the GDP components….
Our personal consumption expenditures (PCE), which are used to compute around 70% of GDP, grew at a 9.93% rate in current dollars in the 1st quarter, which worked out to a real growth rate of 2.7% in consumed goods and services after an annualized PCE price index increase averaging 7.0% was used to adjust that personal spending for inflation . . . consumer spending on durable goods grew at a 10.9% rate in current dollars while prices of those durable goods were on average 6.5% higher, and as a result the BEA found that real growth in output of consumer durables grew at a 4.1% rate, as an increase in real consumption of motor vehicles and parts at a 10.4% rate accounted for about a third of the growth in durable goods output . . . on the other hand, the BEA found that the real output of consumer non-durable goods shrunk at a 2.5% rate, after an increase in consumer spending for non-durable goods at a 12.0% rate was adjusted for an average jump in non-durable prices at a 14.9% rate, as lower real consumption of gasoline and other energy goods accounted for about 80% of the quarter’s nondurable goods pullback . . . meanwhile, the 9.0% nominal growth in consumer outlays for services was deflated by a 4.6% increase in prices for services to show that real output of consumer services grew at a 4.3% annual rate, as real growth of health care, food services and accommodations, and financial services and insurance accounted for more than half the quarter’s growth in services . . . as a result of those changes in growth from the 4th to the 1st quarter, the increase in outlays for durable goods added 0.35 percentage points to 1st quarter GDP, the decrease in real consumption of non-durable goods subtracted 0.38 percentage points from the growth of GDP, while increased consumption of services added 1.86 percentage points to the growth rate of the 1st quarter economy..
The change in other components of the change in GDP is computed by the BEA in the same manner that we have just illustrated for computing real PCE; ie, the annualized increase in current dollar spending for the quarter is adjusted with the annualized inflation factor for that component, yielding the change in real units of goods or services produced during the quarter, at an annual rate . . . thus, after inflation adjustments, real gross private domestic investment, which had grown at a 36.7% annual rate in the 4th quarter of 2021, grew at just a 2.3% annual rate from there in the 1st quarter . . . however, that weak investment increase was due to falling inventory growth; real fixed investment itself grew at a 7.3% annual rate in the 1st quarter, after growing at a 2.7% rate in the 4th quarter…among fixed investments, real non-residential fixed investment grew at a 9.2% rate, even as real investment in non-residential structures shrunk at a 0.9% rate and subtracted 0.02 percentage points from 1st quarter GDP, because real investment in equipment grew at a 15.3% rate and added 0.79 percentage points to 1st quarter GDP, and real investment in intellectual property grew at 8.1% rate and added 0.40 percentage points to GDP….at the same time, real residential investment grew at a 2.1% rate and added 0.10 percentage points to GDP . . . for an easy to understand table as to what’s included in each of those GDP investment categories, see the NIPA Handbook, Chapter 6, page 3…..
Meanwhile, slower growth of real inventories reduced the net change in overall gross investment and hence GDP, as real private inventories grew by an inflation adjusted $158.7 billion in the quarter, after growing at an inflation adjusted $193.2 billion in the 4th quarter . . . as a result, the rounded $34.5 billion negative change in real inventory growth subtracted 0.84 percentage points from the 1st quarter’s growth rate, after a $259.9 billion positive change in real inventory growth in the 4th quarter had added 5.32 percentage points to that quarter’s GDP . . . however, since growth in inventories indicates that more of the goods produced during the quarter would have been left in storage or “sitting on the shelf”, the $34.5 billion reduction in their growth conversely means real final sales of GDP were actually greater by that amount, and hence real final sales of 1st quarter GDP only shrunk at a 0.6% rate in the 1st quarter, down from the real final sales growth rate of 1.5% in the 4th quarter, when the big increase in inventory growth meant that the quarter’s growth in real final sales was much smaller than that of the quarter’s GDP…
Meanwhile, our real exports of goods and services shrunk at a 5.9% rate in the 1st quarter, after growing at a 22.4% rate in the 4th quarter of 2021, while our real imports grew at a 17.7% rate in the 1st quarter, after rising at a 17.9% rate in the 4th quarter . . . as you’ll recall, real increases in exports add to GDP because they are part of our production that was not consumed or added to investment in our country (& hence not counted in GDP figures elsewhere), so conversely that 5.9% decrease in 1st quarter exports subtracted 0.68 percentage points from 1st quarter GDP, after growth in exports had added 2.24 percentage points to 4th quarter GDP . . . on the other hand, real increases in imports subtract from GDP because they are either consumption or investment that was added to another GDP component that shouldn’t have been, because it was not produced in our country and not part of our national product . . . hence, the 17.7% increase in real imports in the 1st quarter subtracted 2.53 more percentage points from 1st quarter GDP, after the 4th quarter’s increase in imports had subtracted 2.46 percentage points from that quarter’s GDP . . . hence our worsening trade imbalance subtracted a rounded net of 3.20 percentage points from 1st quarter GDP, after our deteriorating trade deficit had subtracted a rounded 0.23 percentage points from GDP in the fourth quarter…
Finally, real consumption and investment by all branches of government decreased at a 2.7% annual rate in the 1st quarter, after decreasing at a 2.6% rate in the 4th quarter, as federal government consumption and investment shrunk at a 5.9% rate, while state and local consumption and investment shrunk at a 0.8% rate . . . inflation adjusted federal spending for defense shrunk at a 8.5% rate and subtracted 0.33 percentage points from 4th quarter GDP growth, while real non-defense federal consumption and investment shrunk at a 2.2% rate and subtracted 0.06 percentage points from GDP . . . note that federal government outlays for social insurance are not included in this GDP component; rather, they are included within personal consumption expenditures only when such funds are spent on goods or services, indicating an increase in the output of goods or services . . . meanwhile, state and local government investment and consumption expenditures shrunk at a 0.8% annual rate and subtracted 0.08 percentage points from the growth of 1st quarter GDP, as a real increase in state and local consumption expenditures added 0.10 percentage points from GDP, while real state and local investment shrunk at a 9.3% annual rate and subtracted 0.18 percentage points from GDP…