US Trade Deficit Goods and Services – February
RJS, MarketWatch 666, Summary: US Trade Deficit Virtually Unchanged in February, Near Record High
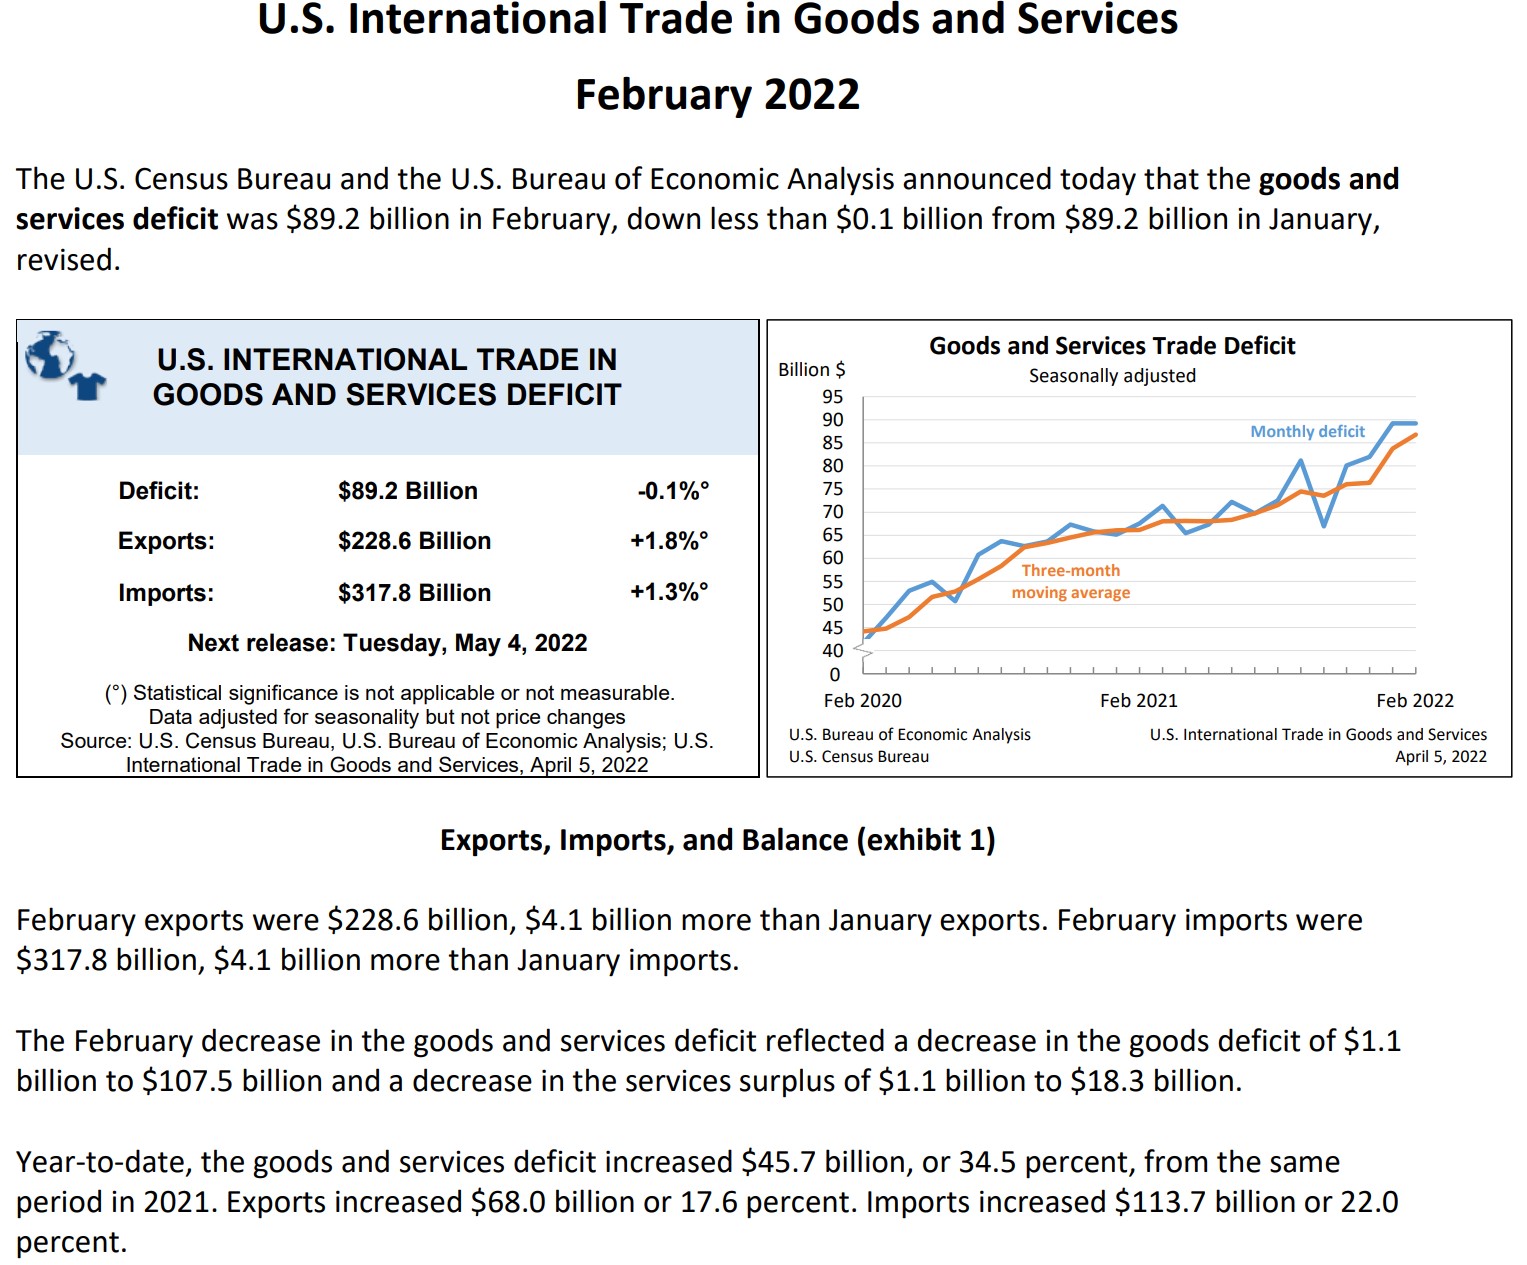
US trade deficit ticked lower February, as both our exports and imports increased, but the value of our exports rose slightly more than the value of our imports did . . . the Commerce Department report on our international trade in goods and services for February indicated that our seasonally adjusted goods and services trade deficit fell by less than $0.1 billion ($44 million) to $89.182 billion (reported as $89.2 billion) in February, from a January deficit that was revised down to $89.229 billion (also reported as $89.2 billion) from the record $89.7 billion deficit reported a month ago…in rounded figures, the value of our February exports rose by $4.1 billion to $228.6 billion on a $2.8 billion increase to $158.8 billion in our exports of goods and a $1.3 billion increase to $69.9 billion in our exports of services, while our imports rose $4.1 billion to $317.8 billion on a $1.7 billion increase to $266.2 billion in our imports of goods and a $2.4 billion increase to $51.6 billion in our imports of services . . . export prices averaged 3.0% higher in February, which means the relative real increase in exports for the month was less than the nominal increase by that percentage, while import prices averaged 1.4% higher, meaning the increase in real imports was smaller than the nominal dollar decrease reported here by that percentage……
The $2.8 billion increase in our February exports of goods resulted from higher exports of industrial supplies and materials and of consumer goods, which were partly offset by lower exports of capital goods . . . referencing the Full Release and Tables for February (pdf), in Exhibit 7 we find that our exports of industrial supplies and materials rose by $1,724 million to $59,864 million on a $764 million increase in our exports of fuel oil, a $449 million increase in our exports of metallurgical grade coal, a $362 million increase in our exports of petroleum products other than fuel oil, a $337 million increase in our exports of natural gas and a $305 million increase in our exports of precious metals other than gold, which were partly offset by a $655 million decrease in our exports of non-monetary gold, and that our exports of consumer goods rose by $1267 million to $20,255 million on a $1,465 million increase in our exports of pharmaceutical preparations . . . in addition, our exports of foods, feeds and beverages rose by $652 million to $14,769 million, led by a $889 million increase in our exports of corn . . . partially offsetting the increases in those end use categories, our exports of capital goods fell by $698 million to $45,407 million on a $1020 million decrease in our exports of civilian aircraft, our exports of automotive vehicles, parts, and engines fell by $289 million to $12,046 million as a $540 million decrease in our exports of new and used passenger cars was partly offset by a $3382 million increase in our exports of parts and accessories of vehicles other than tires, engines and chassis, and our exports in other goods not categorized by end use fell by $43 million to $5,607 million…
Exhibit 8 in the Full Release and Tables gives us seasonally adjusted details on our imports of goods and shows that higher imports of industrial supplies and materials and of capital goods were responsible for the $1.7 billion increase in our February goods imports, while their impact was partly offset by lower imports of automotive vehicles, parts, and engines . . . our imports of industrial supplies and materials rose by $3,368 million to $65,003 million as a $1,932 million increase in our imports of crude oil, a $1,193 million increase in our imports of chemicals other than those itemized, a $878 million increase in our imports of petroleum products other than those itemized, a $782 million increase in our imports of fuel oil, and a $315 million increase in our imports of lumber were partly offset by a $737 million decrease in our imports of copper, a $475 million decrease in our imports of natural gas, a $441 million decrease in our imports of organic chemicals, and a $342 million decrease in our imports of iron and steel mill products…in addition, our imports of capital goods rose by $942 million to $69,735 million as a $474 million increase in our imports of semiconductors, a $353 million increase in our imports of materials handling equipment, and a $300 million increase in our imports of civilian aircraft was partly offset by a $797 million decrease in our imports of telecommunications equipment and a $797 million decrease in our imports of computer accessories . . . at the same time, our imports of consumer goods increased by $523 million to $73,101 million as a $630 million increase in our imports of gem diamonds, a $347 million increase in our imports of textile apparel and household goods other than those of wool or cotton, a $340 million increase in our imports of footwear, a $311 million increase in our imports of furniture and related household goods, a $308 million increase in our imports of gemstones other than diamonds, and a $307 million increase in our imports of cotton apparel and household goods were offset by a $1,142 million decrease in our imports of a cell phones, a $424 million decrease in our imports of pharmaceutical preparations, and a $443 million decrease in our imports of photo equipment . . . meanwhile, our imports of other goods not categorized by end use rose by $505 million to $10,606 million . . . partly offsetting the increase in those import categories, our imports of automotive vehicles, parts and engines fell by $3,230 million to $29,296 million on a $2,178 million decrease in our imports of passenger cars and an $801 million decrease in our imports of trucks, buses, and special purpose vehicles, and our imports of foods, feeds, and beverages fell by $507 million to $16,554 million on a $516 million decrease in imports of foods other than those itemized separately…
The press release for this month’s report summarizes Exhibit 19 in the full release pdf for February, which gives us surplus and deficit details on our goods trade with selected countries:
The February figures show surpluses, in billions of dollars, with South and Central America ($5.7), Hong Kong ($1.4), Singapore ($1.2), Brazil ($1.2), and the United Kingdom ($0.9). Deficits were recorded, in billions of dollars, with China ($41.2), European Union ($17.0), Mexico ($9.8), Canada ($6.8), Germany ($5.4), Japan ($5.1), Taiwan ($4.2), South Korea ($4.1), Italy ($3.0), India ($2.2), Saudi Arabia ($1.0), and France ($1.0).
- The deficit with Mexico decreased $2.7 billion to $9.8 billion in February. Exports increased $0.6 billion to $25.5 billion and imports decreased $2.1 billion to $35.3 billion.
- The deficit with Japan decreased $2.0 billion to $5.1 billion in February. Exports increased $0.9 billion to $7.1 billion and imports decreased $1.1 billion to $12.3 billion.
- The deficit with China increased $7.9 billion to $41.2 billion in February. Exports increased $0.2 billion to $13.0 billion and imports increased $8.1 billion to $54.2 billion.
To gauge the impact of January and February trade data on the eventual 1st quarter GDP growth figures, we use exhibit10 in the full pdf for this report, which gives us monthly goods trade figures by end use category and in total, already adjusted for inflation in chained 2012 dollars, the same inflation adjustment that’s used by the BEA to compute trade figures for GDP, with the only difference being that the amounts in this report are not annualized . . . from that table, we can figure that the 4th quarter’s real exports of goods averaged 151,506.3 million monthly in chained 2012 dollars, while inflation adjusted 1st quarter goods exports were at 147,280 million and 146,110 million for January and February respectively in that same 2012 dollar quantity index representation…averaging January’s and February’s goods exports and then computing the annualized change between that average and the average of the fourth quarter, we find that the 1st quarter’s real exports of goods are running at a 12.11% annual rate below those of the 4th quarter, or at a pace that would subtract about 0.85 percentage points from 1st quarter GDP . . . in a similar manner, we find that our 4th quarter real imports of goods averaged 257,570.3 million monthly in chained 2012 dollars, while inflation adjusted January and February imports were at 265,166 million and 262,386 million respectively, after that same 2012 chained dollars inflation adjustment…that would indicate that so far in the 1st quarter, our real imports of goods have increased at a 9.991% annual rate from those of the 4th quarter . . . since increases in imports subtract from GDP because they represent the portion of consumption or investment that occurred during the quarter that was not produced domestically, their increase at a 9.99% rate would subtract about 1.14 percentage points from 1st quarter GDP . . . hence, if the average trade deficit in goods of the two months reported here is continued in March, the net effect of our international trade in goods will be to subtract around 1.99 percentage points from 1st quarter GDP…
Note that we have not computed the impact of the usually less volatile change in services here because the Census does not provide inflation adjusted data on those, but that the $1.3 billion increase in exports of services vs the 2.4 billion increase in imports of services suggests that February’s trade in services would also be a subtraction from 1st quarter GDP, after a similar imbalance in January’s exports and imports in services suggest the impact of that month’s services trade on GDP would be negative as well…