SPR and Oil Supplies Low, same with Distillates and Products
RJS, Focus on Fracking
Summary: Strategic Petroleum Reserve at a 20 year low, US oil supplies at a 14 year low after record jump in exports; distillates supplies at a 14 year low, total oil + products inventories at an 8 year low; a total oil + products exports at a record high
The Latest US Oil Supply and Disposition Data from the EIA
US oil data from the US Energy Information Administration for the week ending April 15th indicated that because of a record increase in our oil exports, we had to withdraw oil out of our stored commercial crude supplies for the 14th time in 21 weeks and for the 30th time in the past forty-six weeks. Our imports of crude oil fell by an average of 159,000 barrels per day to an average of 5,837,000 barrels per day, after falling by an average of 305,000 barrels per day during the prior week, while our exports of crude oil rose by a record 2,090,000 barrels per day to 4,270,000 barrels per day during the week, after our exports had fallen by an average of 705,000 barrels per day during the prior week . . . applying our oil exports to offset oil supplies from imports to determine our effective trade in oil, we find there was a net import average of 1,567,000 barrels of oil per day during the week ending April 15th, 2,249,000 fewer barrels per day than the net of our imports minus our exports during the prior week . . . over the same period, production of crude oil from US wells was reportedly 100,000 barrels per day higher at 11,900,000 barrels per day, and hence our daily supply of oil from the net of our international trade in oil and from domestic well production appears to have totaled an average of 13,467,000 barrels per day during the cited reporting week…
Meanwhile, US oil refineries reported they were processing an average of 15,717,000 barrels of crude per day during the week ending April 15th, an average of 194,000 more barrels per day than the amount of oil than our refineries processed during the prior week, while over the same period the EIA’s surveys indicated that a net of 1,817,000 barrels of oil per day were being pulled out of the supplies of oil stored in the US . . . so based on that reported & estimated data, this week’s crude oil figures from the EIA appear to indicate that our total working supply of oil from storage, from net imports and from oilfield production was 433,000 barrels per day less than what our oil refineries reported they used during the week . . . to account for that disparity between the apparent supply of oil and the apparent disposition of it, the EIA just inserted a (+433,000) barrel per day figure onto line 13 of the weekly U.S. Petroleum Balance Sheet in order to make the reported data for the daily supply of oil and for the consumption of it balance out, a fudge factor that they label in their footnotes as “unaccounted for crude oil”, thus suggesting there must have been an error or omission of that magnitude in this week’s oil supply & demand figures that we have just transcribed . . . however, since most everyone treats these weekly EIA reports as gospel, and since these figures often drive oil pricing, and hence decisions to drill or complete oil wells, we’ll continue to report this data just as it’s published, and just as it’s watched & believed to be reasonably accurate by most everyone in the industry…(for more on how this weekly oil data is gathered, and the possible reasons for that “unaccounted for” oil, see this EIA explainer)….
This week’s 1,817,000 barrel per day decrease in our overall crude oil inventories left our total oil supplies at 969,713,000 barrels at the end of the week, our lowest oil inventory level since January 11th, 2008, and thus a 14 year low . . . this week’s oil inventory decrease came as 1,146,000 barrels per day were being pulled our commercially available stocks of crude oil, while 672,000 barrels per day of oil were being pulled out of our Strategic Petroleum Reserve at the same time . . . that draw on the SPR included a withdrawal under the initial 30,000,000 million barrel release from the SPR to address Russian supply related shortfalls, as well as an earlier ongoing withdrawal under the administration’s plan to release 50 million barrels from the SPR to incentivize US gasoline consumption . . . including other withdrawals from the Strategic Petroleum Reserve under similar recent programs, a total of 100,169,000 barrels have now been removed from the Strategic Petroleum Reserve over the past 21 months, and as a result the 555,980,000 barrels of oil still remaining in our Strategic Petroleum Reserve is now the lowest since February 1st, 2002, or at a 20 year low, as repeated tapping of our emergency supplies for non-emergencies or to pay for other programs has already drained those supplies considerably over the past dozen years . . . with Biden’s recent “Plan to Respond to Putin’s Price Hike at the Pump”, an additional and unprecedented 1,000,000 barrels per day will be released from the SPR daily starting in May and running up to the midterm elections in November, in the hope of keeping gasoline and diesel fuel prices from rising further up until that time . . . that total 180,000,000 barrel drawdown over six months will remove almost a third of what remains in the SPR at this time, as the following graph illustrates…
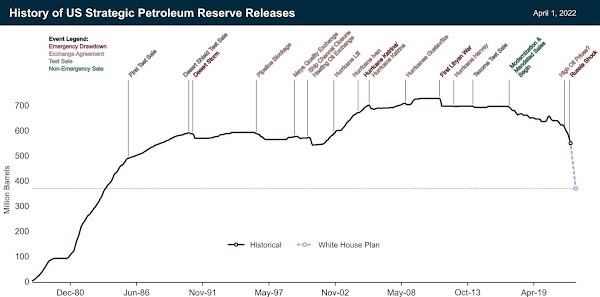
The above graph comes from a post by oil and gas researcher Rory Johnston at Substack, wherein he discusses the implications of the planned SPR release, and it shows the historical quantity of oil held in our Strategic Petroleum Reserve, beginning from its inception following the Arab Oil Embargo of 1973-74 to the present day . . . the graph is further annotated to indicate the reasons for major additions to and withdrawals from the SPR, most of which were due to disruptions to oil supplies following hurricanes in the Gulf (you can get a better view of that by clicking on the graph, or even better yet, the enlarged version at substack.com . . . on the far right, Rory has projected where the strategic petroleum Reserve will end up after the Biden withdrawals are complete, which will take the SPR back to its level of 1983, while it was still being filled . . .based on an estimated average daily US oil consumption of 18,000,000 barrels per day, the US will have roughly 18 1/2 days of oil supply left in the Strategic Petroleum Reserve this November, after all three of the Biden administration’s SPR withdrawal programs have run their course …
Further details from the weekly Petroleum Status Report (pdf) indicate that the 4 week average of our oil imports fell to an average of 6,098,000 barrels per day last week, which was still 3.1% more than the 5,916,000 barrel per day average that we were importing over the same four-week period last year . . . this week’s crude oil production was reported to be 100,000 barrels per day higher at 11,900,000 barrels per day because the EIA’s rounded estimate of the output from wells in the lower 48 states was 100,000 barrels per day higher at 11,500,000 barrels per day, while Alaska’s oil production fell by 16,000 barrels per day to 428,000 barrels per day but had no impact on the final rounded national total….US crude oil production had reached a pre-pandemic high of 13,100,000 barrels per day during the week ending March 13th 2020, so this week’s reported oil production figure was still 9.1% below that of our pre-pandemic production peak, but was 41.2% above the interim low of 8,428,000 barrels per day that US oil production had fallen to during the last week of June of 2016…
US oil refineries were operating at 91.0% of their capacity while using those 15,717,000 barrels of crude per day during the week ending April 15th, up from the 90.0% utilization rate of the prior week, and close to the historical utilization rate for mid April refinery operations . . . the 15,717,000 barrels per day of oil that were refined this week were 6.4% more barrels than the 14,765,000 barrels of crude that were being processed daily during week ending April 16th of 2021, when refineries were still recovering from winter storm Uri, and 26.1 more than the 12,456,000 barrels of crude that were being processed daily during the week ending April 17th, 2020, when US refineries were operating at what was then a much lower than normal 67.6% of capacity at the onset of the pandemic, but 5.2% less than the 16,583,000 barrels that were being refined during the week ending April 19th 2019, when refinery utilization was at a modest 90.1% for the same week of April…
With the increase in the amount of oil being refined this week, gasoline output from our refineries was also higher, increasing by 335,000 barrels per day to 9,836,000 barrels per day during the week ending April 15th, after our gasoline output had increased by 377,000 barrels per day over the prior week . . . this week’s gasoline production was 4.8% more than the 9,386,000 barrels of gasoline that were being produced daily over the same week of last year, and fractionally above the gasoline production of 9,781,000 barrels per day during the week ending April 19th, 2019, ie, the year before the pandemic impacted gasoline output . . . at the same time, our refineries’ production of distillate fuels (diesel fuel and heat oil) increased by 162,000 barrels per day to 4,816,000 barrels per day, after our distillates output had decreased by 388,000 barrels per day over the prior week . . . with that increase, our distillates output was 5.7% more than the 4,555,000 barrels of distillates that were being produced daily during the week ending April 16th of 2021, but 4.9% less that the 5,064,000 barrels of distillates that were being produced daily during the week ending April 19th, 2019…
Even with the increase in our gasoline production, our supplies of gasoline in storage at the end of the week fell for the tenth time in eleven weeks, decreasing by 761,000 barrels to 232,378,000 barrels during the week ending April 15th,after our gasoline inventories had decreased by 3,648,000 barrels over the prior week . . . our gasoline supplies decreased by less this week even though the amount of gasoline supplied to US users increased by 132,000 barrels per day to 8,868,000 barrels per day, because our imports of gasoline rose by 158,000 barrels per day to 597,000 barrels per day while exports of gasoline rose by 32,000 barrels per day to 918,000 barrels per day . . . and even with 10 inventory drawdowns over the past 11 weeks, our gasoline supplies were still only 1.1% lower than last April 16th’s gasoline inventories of 234,982,000 barrels, and 3% below the five year average of our gasoline supplies for this time of the year…
Likewise, even with this week’s increase in our distillates production, our supplies of distillate fuels decreased for the eleventh time in fourteen weeks and for the 23rd time in thirty-three weeks, falling by 2,642,000 barrels to a fourteen year low of 108,735,000 barrels during the week ending April 15th, after our distillates supplies had decreased by2,902,000 barrels during the prior week . . . our distillates supplies fell this week because the amount of distillates supplied to US markets, an indicator of our domestic demand, rose by 338,000 barrels per day to 3,822,000 barrels per day, even while our exports of distillates fell by 261,000 barrels per day to 1,478,000 barrels per day, and while our imports of distillates fell by 50,000 barrels per day to 104,000 barrels per day . . . after thirty-six inventory decreases over the past fifty-two weeks, our distillate supplies at the end of the week were 23.6% below the 143,464,000 barrels of distillates that we had in storage on April 9th of 2021, and about 20% below the five year average of distillates inventories for this time of the year…
The depressed level of our distillate supplies has led to diesel fuel and heat oil prices that are often $1 per gallon more than the already elevated price of gasoline . . . supplies of diesel and pricing of it are also elevated in Europe and globally, leading to economic restrictions in countries that can’t afford it, such as Sri Lanka and Pakistan . . . although those diesel shortages had developed over time, the loss of Russian oil has exacerbated the situation, ie, refineries get more diesel per barrel oil out of a heavy crude than they do from a light one, and most Russian oil exports are medium heavy sour crudes . . . that global shortage of diesel also explains the 1 million barrel per day SPR release better than the administration’s political messaging around gasoline prices . . . for US Gulf Coast and European refineries that were built to use a medium heavy crude like Russian Urals, one has to find an equivalent grade to replace it, or do some expensive blending of other grades to match it . . . remember that the administration’s first frantic moves were to try to get Venezuelan oil and even Iranian oil back on the market to cover that? . . . the US Strategic Petroleum Reserve is 60% heavier grades of crude, so it appears that’s why they’re pulling it out . . . most oil we get from shale is sweet and light, typically more expensive, but worthless when one is trying to replace Russian oil losses…and that also explains our rising exports to Europe. The big jump in our oil exports, combined with elevated exports of distillates and most other petroleum products, also meant that our total exports of crude oil and all the products made from it were at a record high of 10,600,000 barrels during the week ending April 15th, an increase of 17.9% from our total exports of 8,987,000 the prior week, and 60.1% higher than our total exports during the first four weeks of this year, before European demand was impacted by Russian troop movements . . . that sudden spike to a new record for total exports is quite evident in the chart below…

Meanwhile, with the record jump in our oil exports, our commercial supplies of crude oil in storage fell for the 24th time in 38 weeks and for the 33rd time in the past year, decreasing by 8,020,000 barrels over the week, from 421,753,000 barrels on April 8th to 413,733,000 barrels on April 15th, after our commercial crude supplies had increased by 9,382,000 barrels over the prior week…with this week’s decrease, our commercial crude oil inventories slippied to about 15% below the most recent five-year average of crude oil supplies for this time of year, but were still 18.7% above the average of our crude oil stocks as of the third weekend of April over the 5 years at the beginning of the past decade, with the disparity between those comparisons arising because it wasn’t until early 2015 that our oil inventories first topped 400 million barrels . . . since our crude oil inventories had jumped to record highs during the Covid lockdowns of spring 2020, and then jumped again after last year’s winter storm Uri froze off Gulf Coast refining, our commercial crude oil supplies as of this April 15th were 16.1% less than the 493,017,000 barrels of oil we had in commercial storage on April 16th of 2021, and were also 20.2% less than the 518,640,000 barrels of oil that we had in storage on April 17th of 2020, and 10.2% less than the 460,633,000 barrels of oil we had in commercial storage on April 19th of 2019…

Finally, with our inventories of crude oil and our supplies of all products made from oil remaining near multi year lows, we are continuing to keep track of the total of all U.S. Stocks of Crude Oil and Petroleum Products, including those in the SPR . . . the EIA’s data shows that the total of our oil and oil product inventories, including those in the Strategic Petroleum Reserve and those held by the oil industry, and thus including everything from gasoline and jet fuel to propane/propylene and residual fuel oil, fell by 12,795,000 barrels this week, from 1,711,881,000 barrels on April 8th to 1,699,086,000 barrels on April 15th, after our total supplies are down by 89 347,000 barrels over the first fifteen weeks of this year . . . this week was also the first time our total inventories have been below 1.7 billion barrels since March 14th, 2014, and hence our total inventories of oil & its products are at an eight year low, as the graph above shows . . .
interesting tweet: