SPR- 20 year low, Distillate Exports higher, Domestic Supply Low
RJS, Focus on Fracking;
Summary; Strategic Petroleum Reserve at a 20-year low; US distillates exports at a 45 month high leaves domestic supplies at an 8 year low
The Latest US Oil Supply and Disposition Data from the EIA
US oil data from the US Energy Information Administration for the week ending April 8th indicated that after a near record decrease in our oil exports, we were able to add surplus oil to our stored commercial crude supplies for the 7th time in 20 weeks and for the 16th time in the past forty-five weeks . . . our imports of crude oil fell by an average of 305,000 barrels per day to an average of 5,995,000 barrels per day, after rising by an average of 41,000 barrels per day during the prior week, while our exports of crude oil fell by an average of 1,513,000 barrels per day to 2,180,000 barrels per day during the week, after our exports had risen by an average of 705,000 barrels per day during the prior week . . . applying our oil exports to offset oil supplies from imports to get our effective trade in oil, we find there was a net import average of 3,815,000 barrels of per day during the week ending April 8th, 1,208,000 more barrels per day than the net of our imports minus our exports during the prior week . . . over the same period, production of crude oil from US wells was reportedly unchanged at 11,800,000 barrels per day, and hence our daily supply of oil from the net of our international trade in oil and from domestic well production appears to have totaled an average of 15,615,000 barrels per day during the cited reporting week…
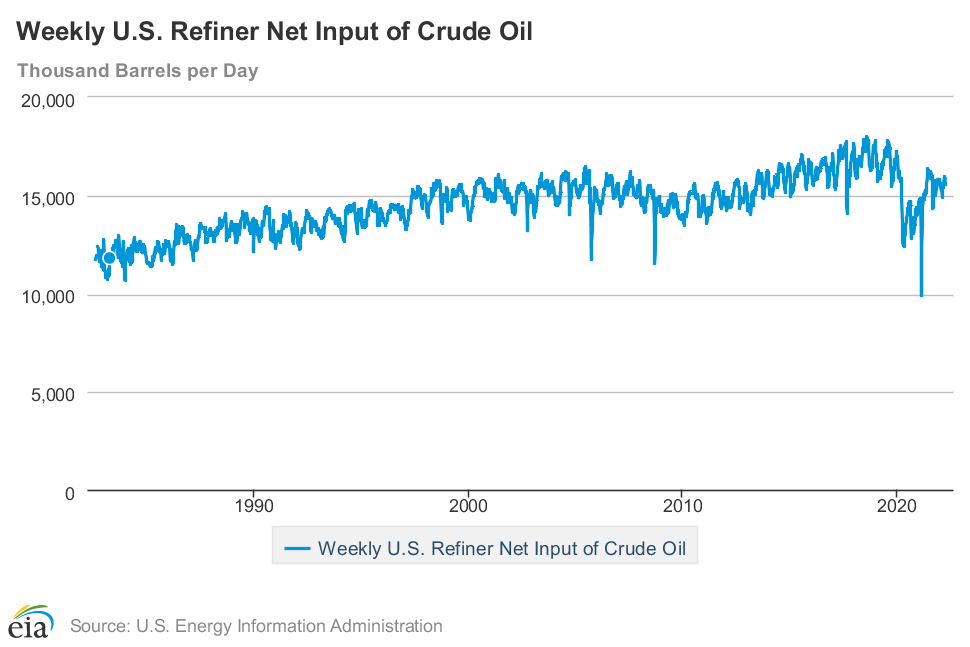
Meanwhile, US oil refineries reported they were processing an average of 15,523,000 barrels of crude per day during the week ending April 8th, an average of 424,000 fewer barrels per day than the amount of oil than our refineries processed during the prior week, while over the same period the EIA’s surveys indicated that a net of 783,000 barrels of oil per day were being added to the supplies of oil stored in the US . . . so based on that reported & estimated data, this week’s crude oil figures from the EIA appear to indicate that our total working supply of oil from net imports and from oilfield production was 691,000 barrels per day less than what was added to storage plus what our oil refineries reported they used during the week . . . to account for that disparity between the apparent supply of oil and the apparent disposition of it, the EIA just inserted a (+691,000) barrel per day figure onto line 13 of the weekly U.S. Petroleum Balance Sheet in order to make the reported data for the daily supply of oil and for the consumption of it balance out, a fudge factor that they label in their footnotes as “unaccounted for crude oil”, thus suggesting there must have been an error or omission of that magnitude in this week’s oil supply & demand figures that we have just transcribed . . . moreover, since last week’s EIA fudge factor was at (+1,352,000) barrels per day, that means there was a 661,000 barrel per day difference between this week’s balance sheet error and the EIA’s crude oil balance sheet error from a week ago, and hence the week over week supply and demand changes indicated by this week’s report are completely useless . . . however, since most everyone treats these weekly EIA reports as gospel, and since these figures often drive oil pricing, and hence decisions to drill or complete oil wells, we’ll continue to report this data just as it’s published, and just as it’s watched & believed to be reasonably accurate by most everyone in the industry…(for more on how this weekly oil data is gathered, and the possible reasons for that “unaccounted for” oil, see this EIA explainer)….
This week’s 783,000 barrel per day increase in our overall crude oil inventories came as 1,340,000 barrels
per day were being added to commercially available stocks of crude oil, while 557,000 barrels per day of oil were being pulled out of our Strategic Petroleum Reserve at the same time . . . that draw on the SPR included a withdrawal under the initial 30,000,000 million barrel release from the SPR to address Russian supply related shortfalls, as well as an earlier ongoing withdrawal under the administration’s plan to release 50 million barrels from the SPR to incentivize US gasoline consumption . . . including other withdrawals from the Strategic Petroleum Reserve under similar recent programs, a total of 95,468,000 barrels have now been removed from the Strategic Petroleum Reserve over the past 21 months, and as a result the 560,681,000 barrels of oil still remaining in our Strategic Petroleum Reserve is now the lowest since March 8th, 2002, or at a 20 year low, as repeated tapping of our emergency supplies for non-emergencies or to pay for other programs has already drained those supplies considerably over the past dozen years…with Biden’s recent announcement, an additional and unprecedented million barrels per day will be released from the SPR daily starting in May and running up to the midterm elections in November, in the hope of keeping gasoline and diesel prices lower up until that time . . . that total 180,000,000 barrel drawdown will remove almost a third of what remains in the SPR at this time, as the following graph illustrates…

Just a reminder, this graph comes from a post by oil and gas researcher Rory Johnston at Substack, wherein he discusses the implications of the planned SPR release, and it shows the historical quantity of oil held in our Strategic Petroleum Reserve, beginning from its inception following the Arab Oil Embargo of 1973-74 to the present day . . . the graph is further annotated to indicate the reasons for major additions to and withdrawals from the SPR, most of which were due to disruptions to oil supplies following hurricanes in the Gulf (you can get a better view of that by clicking on the graph, or even better yet, the enlarged version at substack.com . . . on the far right, Rory has projected where the strategic petroleum Reserve will end up after the Biden withdrawals are complete, which will take the SPR back to its level of 1983, while it was still being filled . . . based on an estimated average daily US oil consumption of 18,000,000 barrels per day, the US will have roughly 18 1/2 days of oil supply left in the Strategic Petroleum Reserve this November, after all three of the Biden administration’s SPR withdrawal programs have run their course …
Further details from the weekly Petroleum Status Report (pdf) indicate that the 4 week average of our oil imports fell to an average of 6,260,000 barrels per day last week, which was still 4.9% more than the 5,971,000 barrel per day average that we were importing over the same four-week period last year . . . this week’s crude oil production was reported to be unchanged at 11,800,000 barrels per day because the EIA’s rounded estimate of the output from wells in the lower 48 states was unchanged at 11,400,000 barrels per day, while Alaska’s oil production fell by 5,000 barrels per day to 443,000 barrels per day but had no impact on the final rounded national total . . . US crude oil production had reached a pre-pandemic high of 13,100,000 barrels per day during the week ending March 13th 2020, so this week’s reported oil production figure was still 9.9% below that of our pre-pandemic production peak, but 40.0% above the interim low of 8,428,000 barrels per day that US oil production had fallen to during the last week of June of 2016…
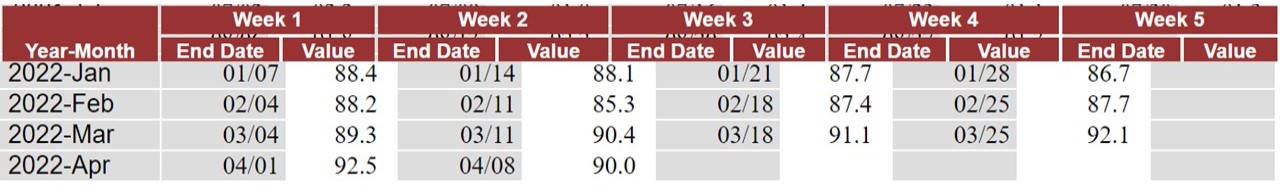
US oil refineries were operating at 90.0% of their capacity while using those 15,523,000 barrels of crude per day during the week ending April 8th, down from the 92.1% utilization rate of the prior week, but still close to the historical utilization rate for early April refinery operations, when spring refinery maintenance programs have just about finished up . . . the 15,523,000 barrels per day of oil that were refined this week were 3.1% more barrels than the 15,051,000 barrels of crude that were being processed daily during week ending April 9th of 2021, when refineries were still recovering from winter storm Uri, and 22.6% more than the 12,665,000 barrels of crude that were being processed daily during the week ending April 10th, 2020, when US refineries were operating at what was then a much lower than normal 69.1% of capacity at the onset of the pandemic, but 3.5% less than the 16,078,000 barrels that were being refined during the week ending April 12th 2019, when refinery utilization had slipped to an 8 year low of 87.7% for the same week of April…
Even with the decrease in the amount of oil being refined this week, gasoline output from our refineries was still higher, increasing by 377,000 barrels per day to 9,501,000 barrels per day during the week ending April 8th, after our gasoline output had increased by 70,000 barrels per day over the prior week . . . but this week’s gasoline production was still 1.2% less than the 9,615,000 barrels of gasoline that were being produced daily over the same week of last year, and 4.2% less than the gasoline production of 9,917,000 barrels per day during the week ending April 12th, 2019, ie, the year before the pandemic impacted output . . . on the other hand, our refineries’ production of distillate fuels (diesel fuel and heat oil) decreased by 388,000 barrels per day to 4,654,000 barrels per day, after our distillates output had decreased by 49,000 barrels per day over the prior week…even with those decreases, our distillates output was 10.1% more than the 4,228,000 barrels of distillates that were being produced daily during the week ending April 9th of 2021, but 3.5% less that the 5,038,000 barrels of distillates that were being produced daily during the week ending April 12th, 2019…
With the increase in our gasoline production, our supplies of gasoline in storage at the end of the week fell for the ninth time in ten weeks, decreasing by 3,648,000 barrels to 233,139,000 barrels during the week ending April 8th,after our gasoline inventories had decreased by 2,041,000 barrels over the prior week….our gasoline supplies decreased again this week because the amount of gasoline supplied to US users increased by 174,000 barrels per day to 8,736,000 barrels per day, and because our imports of gasoline fell by 45,000 barrels per day to 439,000 barrels per day while our exports of gasoline fell by 94,000 barrels per day to 886,000 barrels per day, . . . and even with 9 inventory drawdowns over the past 10 weeks, our gasoline supplies were still only 0.7% lower than last April 9th’s gasoline inventories of 234,897,000 barrels, and 3% below the five year average of our gasoline supplies for this time of the year…
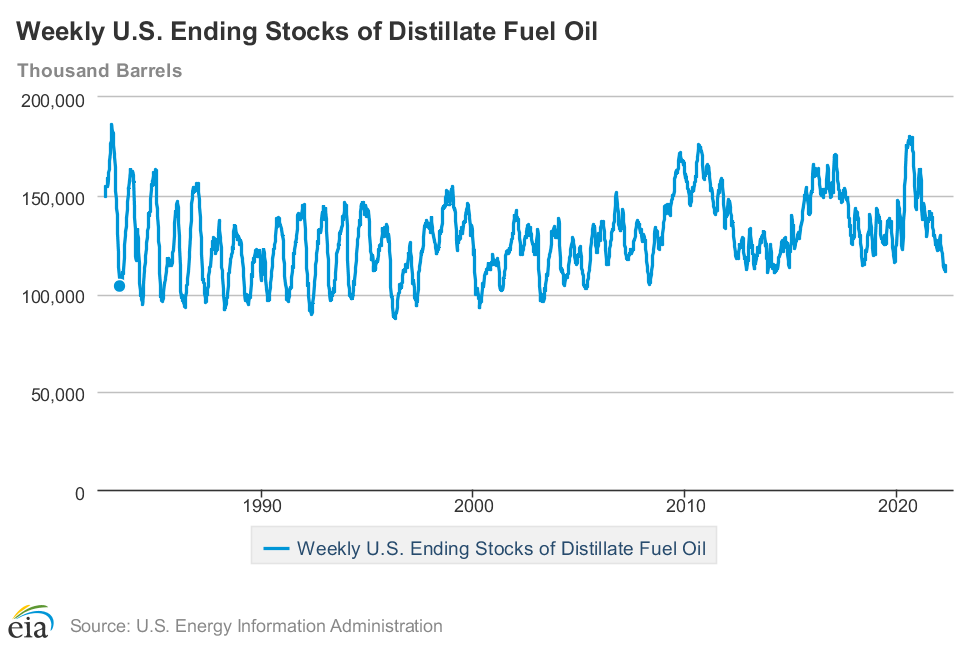
Meanwhile, with this week’s big decrease in our distillates production, our supplies of distillate fuels decreased for the tenth time in thirteen weeks and for the 22nd time in thirty-two weeks, falling by 2,902,000 barrels to an eight year low of 111,399,000 barrels during the week ending April 8th, after our distillates supplies had increased by 771,000 barrels during the prior week . . . our distillates supplies fell this week even though the amount of distillates supplied to US markets, an indicator of our domestic demand, fell by 163,000 barrels per day to 3,484,000 barrels per day, because our exports of distillates rose by 366,000 barrels per day to a 45 month high of 1,739,000 barrels per day, while our imports of distillates rose by 66,000 barrels per day to 154,000 barrels per day . . . after thirty-six inventory decreases over the past fifty-two weeks, our distillate supplies at the end of the week were 22.3% below the 143,464,000 barrels of distillates that we had in storage on April 9th of 2021, and about 17% below the five year average of distillates inventories for this time of the year…
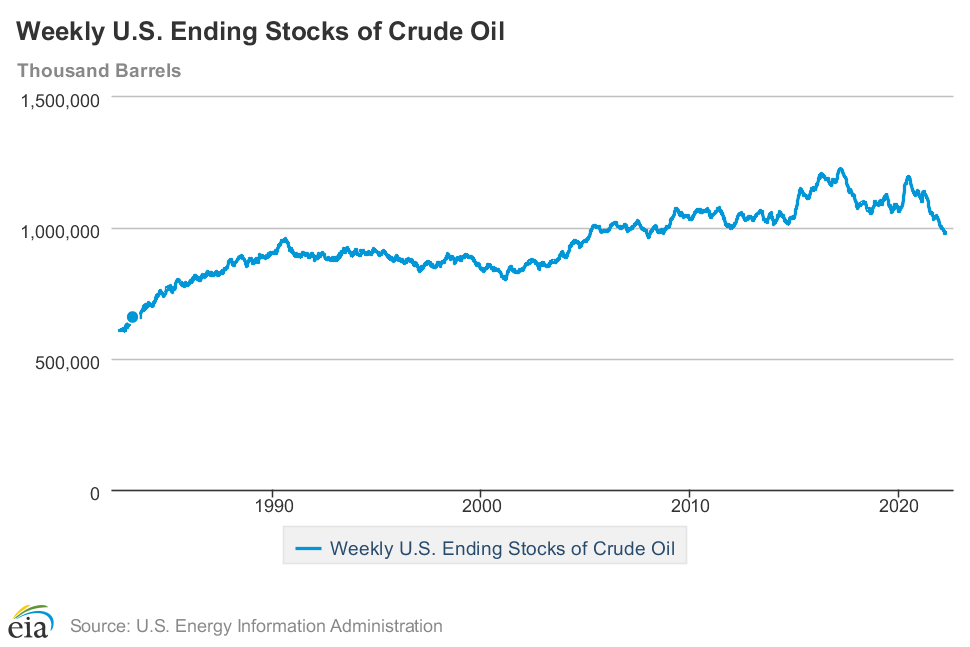
With the near record drop in our oil exports, our commercial supplies of crude oil in storage rose for the 14th time in 37 weeks and for the 20th time in the past year, increasing by 9,382,000 barrels over the week, from 412,371,000 barrels on April 1st to 421,753,000 barrels on April 8th, after our commercial crude supplies had increased by 2,421,000 barrels over the prior week . . . with this week’s increase, our commercial crude oil inventories were about 13% below the most recent five-year average of crude oil supplies for this time of year, but were nearly 30% above the average of our crude oil stocks as of the second weekend of April over the 5 years at the beginning of the past decade, with the disparity between those comparisons arising because it wasn’t until early 2015 that our oil inventories first topped 400 million barrels . . . since our crude oil inventories had jumped to record highs during the Covid lockdowns of spring 2020, and then jumped again after last year’s winter storm Uri froze off Gulf Coast refining, our commercial crude oil supplies as of this April 8th were 14.4% less than the 492,423,000 barrels of oil we had in commercial storage on April 9th of 2021, and were also 16.3% less than the 503,618,000 barrels of oil that we had in storage on April 10th of 2020, and 7.3% less than the 455,154,000 barrels of oil we had in commercial storage on April 12th of 2019…
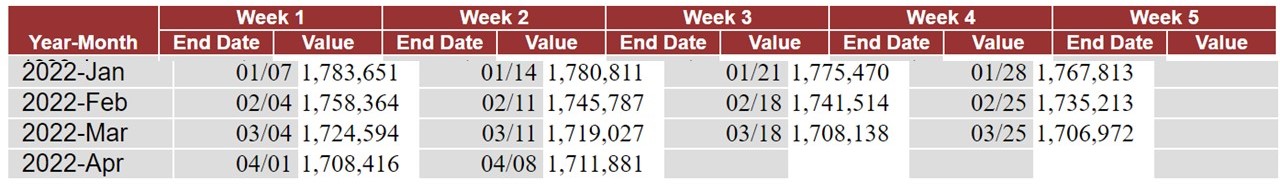
Finally, with our inventory of crude oil and our supplies of all products made from oil remaining near multi year lows, we are continuing to keep track of the total of all U.S. Stocks of Crude Oil and Petroleum Products, including those in the SPR . . . the EIA’s data shows that the total of our oil and oil product inventories, including those in the Strategic Petroleum Reserve and those held by the oil industry, and thus including everything from gasoline and jet fuel to propane/propylene and residual fuel oil, rose by 3,465,000 barrels this week, from 1,708,416,000 barrels on April 1st to 1,711,881,000 barrels on April 8th, the second increase after our total supplies had decreased by 81,461,000 barrels over the first twelve weeks of this year . . . hence that increase still left our total supplies of oil & its products less than 5 million barrels higher than what would be an 8 year low dating back to April 4th, 2014…