Prices soar, sales drop; oh by the way, sales lead prices
Prices soar, sales drop; oh by the way, sales lead prices
New home sales declined -8.6% in March, which isn’t as sharp as it seems since declines of this magnitude happen 2-3x/year. The series is also heavily revised, so no new month’s number should be given too much weight. On the other hand, new home sales are frequently the first series to decline after a peak, so the fact that they have not made a new high since January of last year, and are now almost 25% below that mark is certainly a sign that higher interest rates and prices have taken their toll:

Very much on the other hand, the month over month % change in both the Case Shiller and FHFA Indexes rose at record paces of ~2% last month alone:

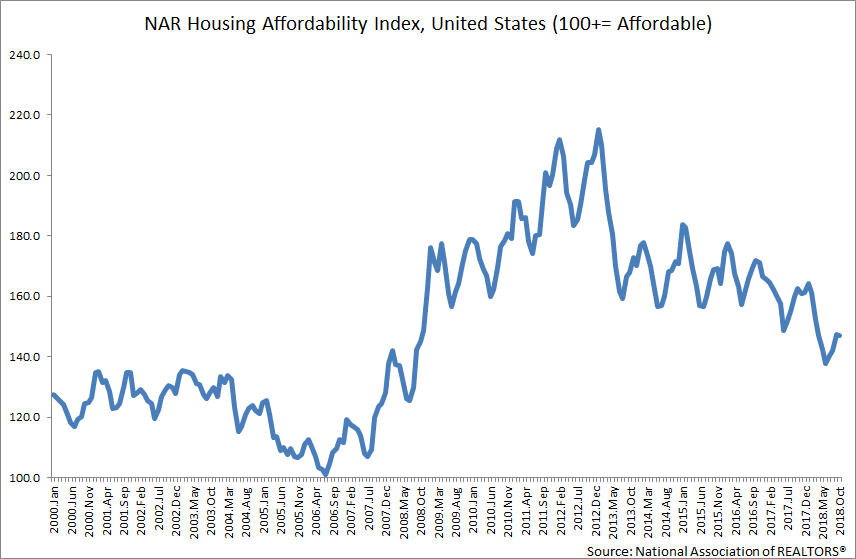
All of this has caused the National Affordability Index kept by Realtor.com to decline to 135:

This is the lowest level of affordability since 2008 (note below graph stops in 2018)
And as I always say, sales lead prices, so here is the YoY% change in sales (averaged quarterly, blue) vs. both FHFA and Case Shiller prices:

So it shouldn’t take a genius to figure out where I think home prices are headed.
A soaring trade deficit detracted from U.S. economic growth figures
NY Times – April 28
The economy contracted in the first quarter, but underlying measures were solid
I see affordable lumber, affordable lumber everywhere! All hail the pressure treated gods of old! We shall raise these wooden chicken coops to offer manna to the people!
MS,
Speaking of “All hail the pressure treated gods of old,” then the old (2003 and earlier manufacture) lasted more consistently longer. I have a few 4X4 and 6X6 posts and ground contact retainers from 2005 that have been blown out and decaying for a few years already, but most of them are still servicing well. The worst fear back at that time was that the new formula would corrode steel fasteners and even 5/8″ rebar stakes, but I have seen no evidence of that.
Arsenic was discontinued in PT-wood manufacture at the end of 2003. My guess is that by now producers have had a chance to work the bugs out of the new formulation for PT-wood.
Ron:
I live in a growing subdivision which has ponds they call lakes and with faux waterfalls. The use treated water in these ponds, recycled, and not safe to drink. Bordering some of the pond is steel posts sunk in concrete, not in the water, and have constant moisture even when it is hot out. They rusted.
Now anyone who has steel above a window (lintel) knows it rusts as the moisture gets it wet. As it rusts it pressures the brick and the brick shatters over time. Was a laborer for my dad in helping him fix the steel and replace the bricks.
Anyway and as a courtesy, I suggested to the Homeowners hired manager he might consider a coating on the posts before sinking them in the concrete. No return, just crickets. Which means it will be bare steel sunk in concrete again, And as it rusts and swells, it will crack the concrete, and break loose again in a few years.
Run,
I knew that over time they would rust being either steel or iron, but until you told me then I did not know that they were called lintels. Growing up I lived in one bought and two rented shingled frame homes and eventually my parents moved into a double wide on four acres purchased from dad’s oldest brother near Brightwood, VA. Never learned anything about brick home construction.
I got two French doors, five single windows, five double windows, and a 7′ X 11′ sectional window, all with steel/iron lintels overhead, but only one French door has some rust bleeding through the paint. The original 1959 construction has 3/16″ metal plate lintels, but the 1965 addition with one French door and two double windows only used 1/8″ metal. Given the condition after all this time then it is possible that the metal plates were etched with phosphoric acid and primed before installation. The only settling crack anywhere in the brick and mortar of my home is a tiny separation at the join for the addition. OTOH, my patio and patio wall have settled terribly as a matter of inadequate substrate preparation, but are still usable. Fortunately, the footing and foundation of the house are fine.
Ron:
Iron will not rust as bad. Even so, the rust will shatter bricks and break concrete.
NDd:
What I read today in Quartz;
The US economy shrank 1.4% in the first quarter compared to the same period in 2021, but that number isn’t a complete picture of where the US economy is headed.
Private final domestic demand—which strips out inventories and net exports—was up 3.7% in the first quarter, showing that Americans were still ready to get out and spend during the first quarter. Other signs the recovery is on solid footing: Consumption moved up 2.7%, business fixed investment was up 9.2%, and residential investment was up 2.1%.