The return of the “Oil Choke Collar”!
The return of the “Oil Choke Collar”!
For the first five years after the end of the Great Recession, one of the staples of my analysis was the concept of the “oil choke collar.” By that I meant that typically recessions had occurred after there was a sudden and sharp upward spike in the cost of gas, inflicting such pain that consumers cut back drastically on other spending – causing a prompt economic downturn. But what if, instead, gas prices rose more gradually to the pain threshold? Then we could expect consumers to react less drastically, cutting back marginally on other purchases. The economy would slow, gas prices would retreat, the pain would go away, and consumers would resume their prior purchases. And repeat.
In other words, gas prices would act as a “choke collar” on the economy, biting and relaxing as consumer purchases waxed and waned. There would be no recession, but no great growth either.
And then, in 2014, gas prices fell precipitously from $3.75 to just over $2 a gallon. That put an end to the oil choke collar!
Is it coming back? Last week I wrote that gas prices had increased almost 30% above their average level of the past 5 years, And so I anticipated some consumer distress.
I mentioned the idea in my “Weekly Indicators” column, which caused several long-time readers to pipe up and ask about the status of the “oil choke collar.”
So let’s take a look.
The “oil choke collar” does not depend upon the absolute price of gas, but rather its relationship to spending. There are at least 3 ways of comparison: (1) to average wages, (2) to disposable income, and (3) to GDP. The first two are measures of the hit gas purchases made to consumers’ wallets, and the third measures against the entire economy. Below I’ll look at each in turn. Note that weekly gas prices weren’t compiled until after 1990, so for the period before that I use Texas crude spot prices only.
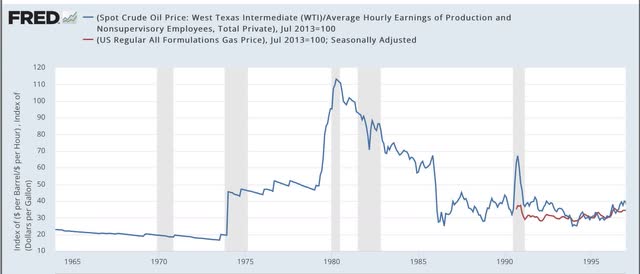
1. Vs. wages
1972-97:
1997-2022:
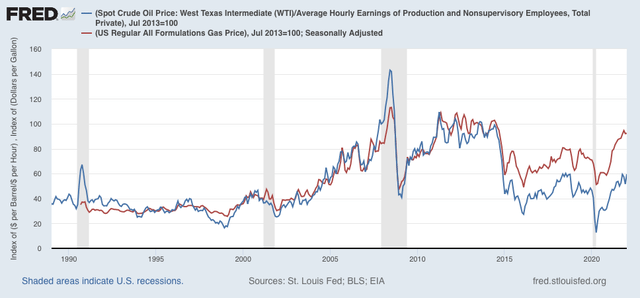
The OPEC oil shocks of the 1970’s, the Kuwait invasion shock of 1990, and the 2006-08 shocks stand out. In addition to the 2010-14 period, the 1975-79 period also stands out as a period of a “choke collar,” with consistent elevated prices that mainly went sideways, operating as a depressant on the economy without causing recessions.
Measured in terms of gas prices (not oil prices), we are about 10% below the price where the “choke collar” would take effect.
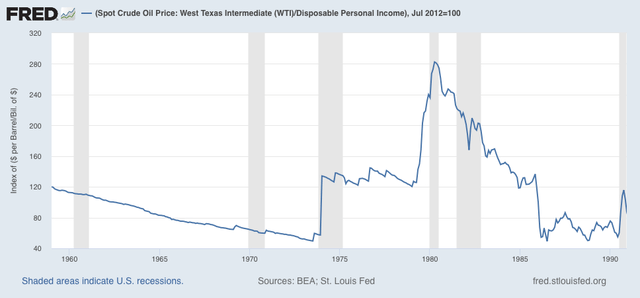
2. Vs. Disposable personal income
This is an even better comparison than just against hourly wages, since it measures the hit to discretionary spending.
1957-90:
1991-2022:
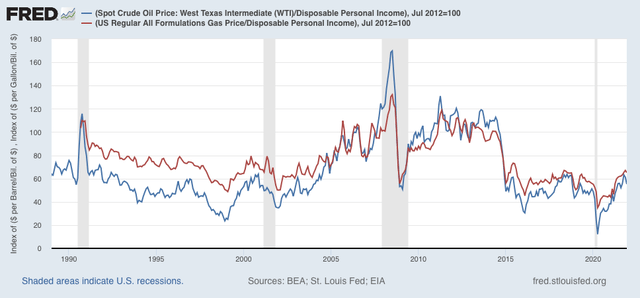
Note that I’ve normed both graphs to 100 as of July 2012, a typical month of the “oil choke collar” period. We see that any sudden sharp move substantially above 100 has been consistent with a recession, while periods oscillating about 100 are eras of subpar growth. The current value is just over 65% for gas prices, meaning they would have to rise to about $4.25 a gallon for the “choke collar” to engage.
3. Vs. GDP
Oil analyst Steven Kopitsin the past has written that every time Oil prices rise to a level of 4% or more of GDP, a recession has followed. The below graphs norm that to 100 as displayed.
1991-2022:
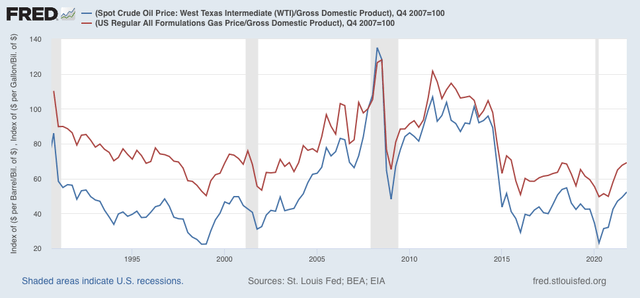
Once again, we see that every time this metric shoots suddenly past 100, a recession has occurred. The two times it has oscillated around that point – in the later 1970s and 2010-14 – there has been no recession, but growth has suffered.
The metric for gas prices currently measures at roughly 70. Again, gas prices of roughly $4.25 a gallon would engage the “choke collar,” equivalent to about oil prices at $125/barrel.
As I write this, oil prices are about $93/barrel, and gas prices are about $3.50/gallon. As I wrote last week, because this is a big jump compared with the last 5 years, I expect there to be some consumer distress. But we aren’t at the point of engaging the “oil choke collar” yet.
Bill McBride, last week:
note that metric would include more than just gasoline…energy utilities, for instance…perhaps the 12% YoY increase in rents may be more choking…
also consider that the markets are indicating this is a temporary price spike…March 2022 WTI closed at $95.46 today; March 2023 WTI closed at $80.44; March 2022 gasoline closed at $2.7794; March 2023 gasoline closed at $2.3202
https://www.barchart.com/futures/quotes/CLH22/price-history/historical
https://www.barchart.com/futures/quotes/CLH23/price-history/historical
https://www.barchart.com/futures/quotes/RBH22/price-history/historical
https://www.barchart.com/futures/quotes/RBH23/price-history/historical
rjs,
Awesome – kinda/sorta. No “stagflation” oil choke collar to slow the economy or feed the ghost of Uncle Milty Friedman, but apparently no meaningful progress on the UN Paris Agreement either.