The Omicron wave has receded by almost 90%; what about deaths?
Coronavirus dashboard for February 23: the Omicron wave has receded by almost 90%; what about deaths?
No economic data today (Feb. 23), so let’s update the situation with COVID-19. My usual source of graphs, 91-Divoc, is down today, so less elaborate, cluttered graphs from the NYT site to follow.
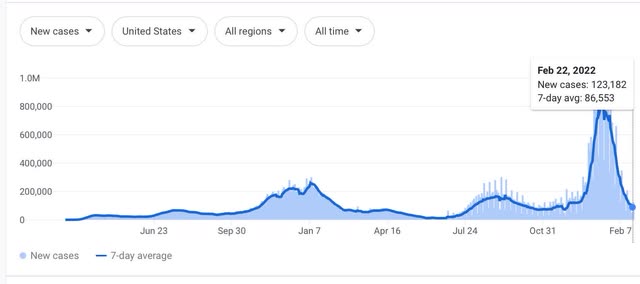
The Omicron wave peaked in the US on January 14, at a 7 day average of 806,928. As of yesterday, the average was 86,553, an 89% decline! But before you get too excited, while that is the lowest number since mid-November (minus the days after Thanksgiving when there was very limited reporting), it remains higher than at any point during 2020 before November of that year, and between March and August of 2021. In order to get down to their July 2021 lows, cases would have to continue to decline at their same rate since peak for another 4 to 5 weeks:
Deaths during the Omicron wave peaked on February 1, (only) 18 days after cases, at a 7 day average of 2,670. As of yesterday, they were down 27% at 1,939, conquerable to where they were on January 14, 18 days before the peak:
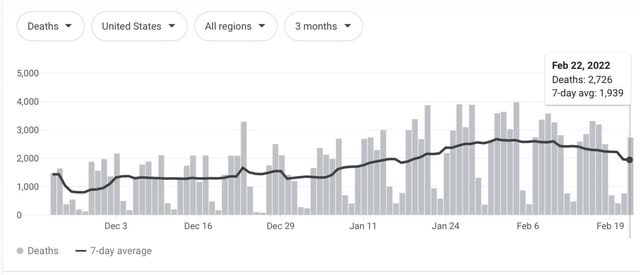
This is a slower rate of decline than cases, which 21 days after their peak were already down 60%!. Cases were already down 27% from peak only 13 days later.
On the one hand, if deaths were to decline in line with cases, we would expect deaths to be down to about 300 within a month. On the other hand, if deaths continue to decline as they have since their peak, then within a month they will be about 1200. That’s a big difference!
Let’s turn to a State which had an early and huge Omicron wave, New York, for further clues.
Cases in NY peaked on January 9 at 74,186. They are now, 44 days later, at 2,975, or a decline of 96%!
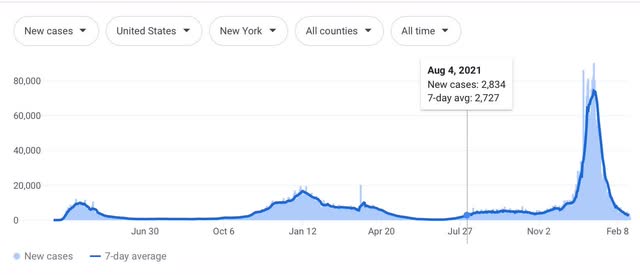
This is the lowest number of new cases since August 4, although for perspective NY had its lowest number of cases on June 25 at 314.
Deaths peaked in NY on January 22, only 13 days after cases, at 206. They are now, 31 days after the peak, at 58:
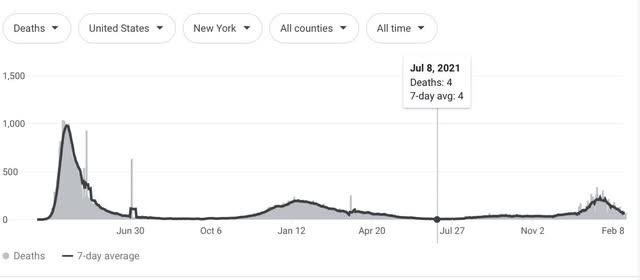
This is a 72% decline. By contrast, 31 days after the peak in cases NY was down 91%. Cases had declined by 72% on January 27, only 18 days after their peak.
Note that the NY comparison, -72% in deaths vs. -91% in cases the same length of time after peak, is much closer than the US comparison, -27% vs. -89%. Also, NY cases peaked 5 days before the US as a whole, and deaths in NY peaked 10 days before the US as a whole.
In other words, the peaking process in deaths for the US as a whole was much more extended than for NY. Put another way, deaths in the US have shown a more extended peaking process in the US compared with cases. This is more in line with earlier waves of the virus, where deaths peaked 3 to 4 weeks after cases.
There is evidence of the same pattern in other countries. Deaths in the UK had a similar long peak compared with cases, before falling in lockstep, now down about 50%. Portugal is also showing a similar long peak in deaths, but since cases only peaked 3 weeks ago, more cannot be said. The same is the case with Israel. In Canada deaths look slightly elongated as well, but are now down over 50%, following the pattern in cases (no graphs, because of the aforesaid glitch with 91-Divoc today).
If we figure that the wave in deaths is more extended on both the upside and downside, than we can expect the decline in deaths to accelerate now that we are 3 weeks past peak, more in line with the NY decline, making for a roughly 70% decline from peak within a month. That amounts to about 800 deaths per day, still lower than at any time during 2020, and lower than any time during 2021 except for May through early August.