Omicron declines sharply
Coronavirus Dashboard for February 8: Omicron declines sharply; did Delta provide protection against the worst outcomes?
As I mentioned yesterday, I haven’t posted a Coronavirus dashboard in awhile, and with Omicron in rapid retreat, it’s time for an update.
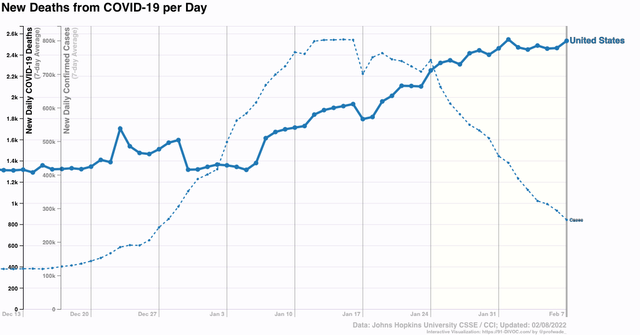
To begin with, deaths are presently peaking at roughly 2450 a day, while nationwide cases are down almost 2/3’s:
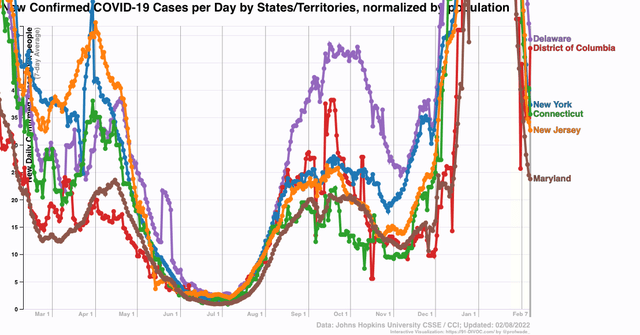
There are over a dozen States where numbers are now down close to, at, or even below their pre-Omicron outbreak levels. In particular, the Northeast region and Puerto Rico down over 85%. NY, NJ, CT, DC, DE, and MD are at the same level as they were last April, well below their winter 2020-21 peaks, and as of yesterday were still declining with no signs of stopping. *If* the current rate of decline of 50% per week is maintained, they will be at last June’s lows in about 4 weeks:
One thing that is somewhat surprising is that the relative rates of cases from Omicron does not correlate that strongly with previous vaccination rates. To cut to the chase, a previous bad Delta outbreak may have provided some protection against Omicron.
Here are the last 8 weeks (basically the time since Omicron hit) for the 10 most vaccinated (with 2 or more doses) jurisdictions, compared with the nationwide level (in red):
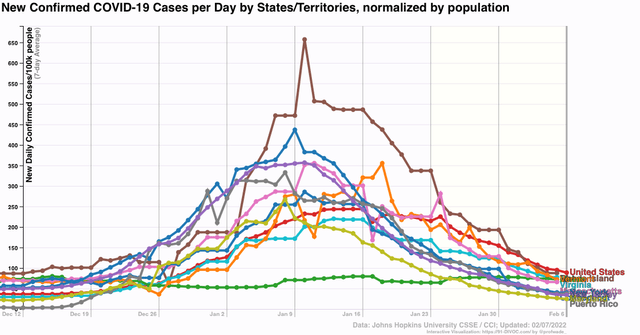
Note that many of them had substantially worse Omicron outbreaks than the average.
And here are the 10 least vaccinated jurisdictions:
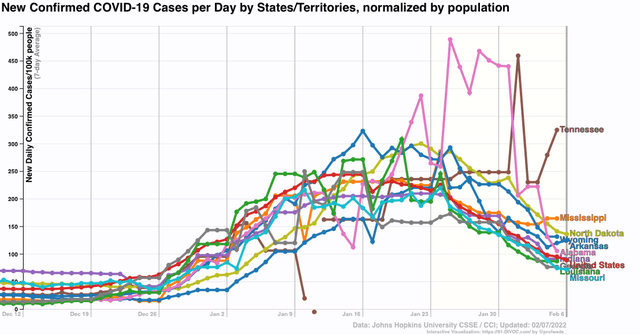
Many of these had *lower* numbers than the national average.
It appears that the heavily vaccinated jurisdictions, being urban travel hubs, were exposed to Omicron first, and are further along in their declines, while the least vaccinated jurisdictions tend to be more rural, were hit later, and are declining less so far (and Tennessee is still increasing!). This pattern is more evident when we compare the jurisdictions with the lowest current rates of infection:
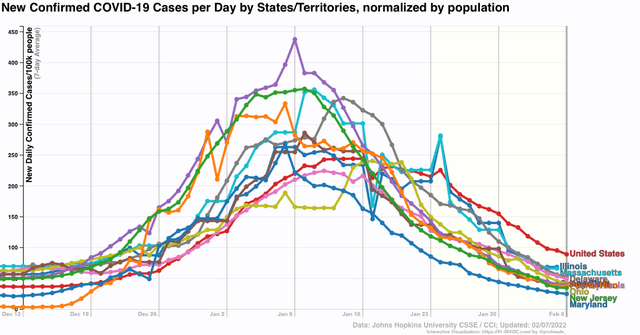
With those having the highest current rates of infection:
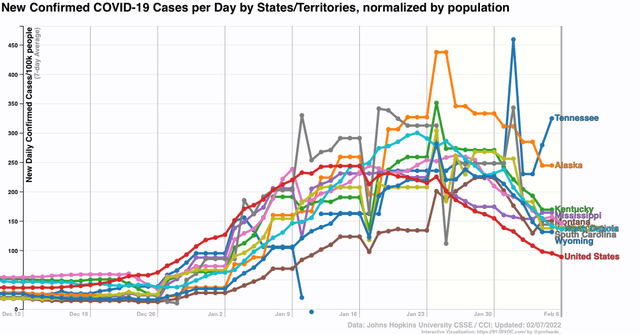
Again, urban areas were hit earlier, and have declined from peak more sharply than more rural areas.
The pattern is similar when we turn to deaths. For the US as a whole, total deaths in the past 8 weeks average 31.3 per 100,000.
Here’s the death rates for the 10 most vaccinated jurisdictions (including PR, but not DC):
PR (80% vaxxed) (20.9 deaths per 100,000)*
VT 80% 19.4*
RI 79% 37.5
ME 78% 31.0
MA 77% 39.5**
CT 77% 33.3
HI 76% 11.9*
NY 75% 39.0
NJ 73% 38.2
MD 73% 40.8**
And here is the same for the 10 least vaccinated jurisdictions:
AL 49% 22.6
WY 50% 30.8
MS 50% 31.
0LA 52% 22.1
AR 53% 32.6T
N 53% 47.8**
GA 53% 24.3
IN 53% 54.9**
ND 54% 24.7
MO 55% 35.1
*among 10 best rates
** among 10 worst rates
Other States included in the 10 best rates of deaths are:
CA 14.7
UT 16.7
WA 18.5
OR 19.7
MT 19.7
FL 19.8
NC 20.3
Other States included in the 10 worst rates of deaths are:
MI 59.7
PA 54.1
NM 50.7
AZ 49.3
WV 42.6
OH 41.4
While some highly vaccinated States – CA, OR, WA – have among the best records, others – PA – do not. And while some of the least vaccinated States – WV, MI – have terrible records, several others – FL, MT, UT – have among the best records.
To sum up, Omicron seems to have hit highly urbanized areas first and hardest, and more rural areas later on. In the urban areas, cases are declining sharply, while in rural areas deaths are still at or nearer their peaks. Vaccination status seems to be only weakly correlated with Omicron outcomes. This probably doesn’t have anything to do with any shortcomings in the vaccines, but rather the effect of recent bad Delta outbreaks (concentrated in the poorly vaccinated States) providing some protection against the worst outcomes from Omicron.
Masks Come Off in More States
NY Times – Feb 9
Mask mandates continue to fall
Washington Post – Feb 9
Fauci says U.S. may be approaching ‘normality’
re: “Fauci says U.S. may be approaching ‘normality’“
he’s raising the bar on what’s normal…we still had more new cases this week than any other weehs during the entire pandemic outside of January this year & December & January of last year…Covid deaths are likewise higher than any time other than January & February of last year..
stealth Omicron rising?
Massachusetts drops school mask order, but some parents, doctors fear it’s too soon
Boston Globe – Feb 10
My kids have been in “mask optional” schools since May 2021. Last month of that school year (which was in-person for the entire year, but with masks) and all this year. One consideration maybe should be mast quality. What is now commonly accepted is the virus has fully aerosol dispersal. Cloth masks and surgery procedure masks do nothing important against aerosol dispersal. If the student population of a school is allowed to wear these masks, then they are already “mask optional”. The nearly full year my kids went to school masked, they and all the other kids were wearing cloth masks, or procedure ones if the forgot or got them messy at school.