Oil at 10-year Low, SPR at 19-Year low, Total oil & products supply at 7 1/2-year low
Oil supplies at a 10 year low; SPR at a 19 year low, total oil & products supplies at 7 1/2 year low; Omicron hit to demand leads to largest 5 week increase of gasoline inventories in 32 years
RJS: The Latest US Oil Supply and Disposition Data from the EIA, Focus on Fracking
US oil data from the US Energy Information Administration for the week ending January 28th indicated that despite a jump in our oil imports and a drop in our oil exports, a major reversal from unaccounted for supply to unaccounted for demand meant we had to pull oil out of our stored commercial crude supplies for the eighth time in 10 weeks and for the 24th time in the past thirty-six weeks . . . our imports of crude oil rose by an average of 849,000 barrels per day to an average of 7,085,000 barrels per day, after falling by an average of 509,000 barrels per day during the prior week, while our exports of crude oil fell by an average of 420,000 barrels per day to an average of 2,376,000 barrels per day during the week, which together meant that our effective trade in oil worked out to a net import average of 4,709,000 barrels of per day during the week ending January 28th, 1,269,000 more barrels per day than the net of our imports minus our exports during the prior week . . . over the same period, production of crude oil from US wells was reportedly 100,000 barrels per day lower at 11,500,000 barrels per day, and hence our daily supply of oil from the net of our international trade in oil and from domestic well production appears to have totaled an average of 16,209,000 barrels per day during the cited reporting week…
Meanwhile, US oil refineries reported they were processing an average of 15,248,000 barrels of crude per day during the week ending January 28th, an average of 248,000 fewer barrels per day than the amount of oil that our refineries processed during the prior week, while over the same period the EIA’s surveys indicated that a net of 417,000 barrels of oil per day were being pulled out the supplies of oil stored in the US . . . so based on that reported & estimated data, this week’s crude oil figures from the EIA appear to indicate that our total working supply of oil from net imports, from storage, and from oilfield production was 1,377,000 barrels per day more than what our oil refineries reported they used during the week . . . to account for that disparity between the apparent supply of oil and the apparent disposition of it, the EIA just inserted a (-1,377,000) barrel per day figure onto line 13 of the weekly U.S. Petroleum Balance Sheet to make the reported data for the daily supply of oil and the consumption of it balance out, essentially a balance sheet fudge factor that they label in their footnotes as “unaccounted for crude oil”, thus suggesting there must have been an error or omission of that magnitude in this week’s oil supply & demand figures that we have just transcribed . . . moreover, since last week’s EIA fudge factor was at (+617,000) barrels per day, that means there was a 1,994,000 barrel per day difference between this week’s balance sheet error and the EIA’s crude oil balance sheet error from a week ago, and hence the week over week supply and demand changes indicated by this week’s report are completely worthless . . . however, since most everyone treats these weekly EIA reports as gospel and since these figures often drive oil pricing, and hence decisions to drill or complete oil wells, we’ll continue to report this data just as it’s published, and just as it’s watched & believed to be reasonably accurate by most everyone in the industry…(for more on how this weekly oil data is gathered, and the possible reasons for that “unaccounted for” oil, see this EIA explainer)….
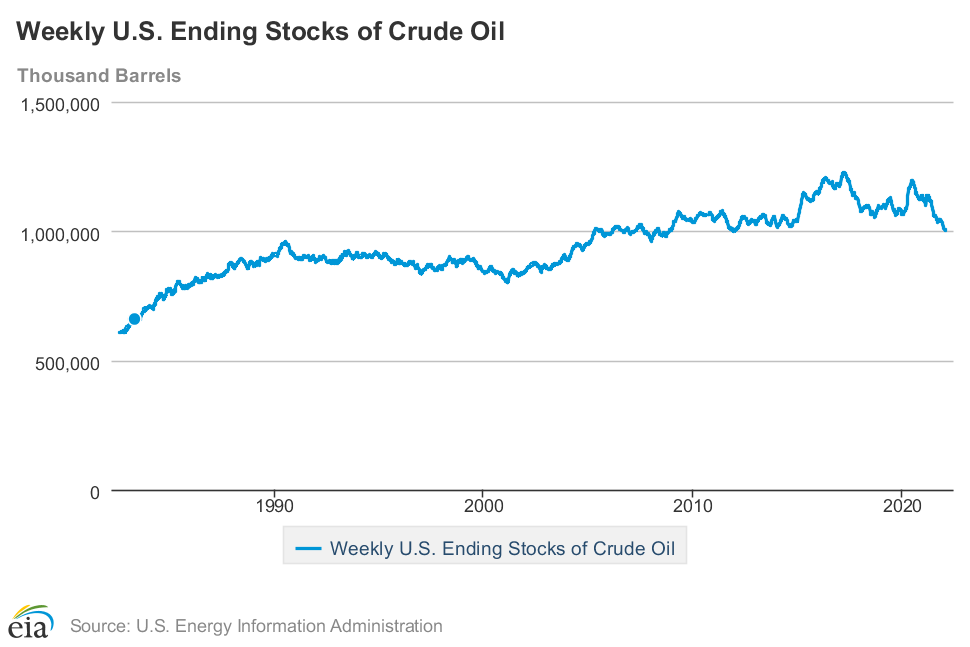
This week’s 417,000 barrel per day decrease in our overall crude oil inventories left our total oil supplies at 1,004,055,000 barrels, the lowest since January 13th, 2012, and hence at a 10 year low…this week’s oil inventory decrease came as 149,000 barrels per day were being pulled out of our commercially available stocks of crude oil, while 267,000 barrels per day of oil were being pulled out of our Strategic Petroleum Reserve, part of the first installment of Biden’s plan to release 50 million barrels from the SPR, in order to incentivized continued use of US gas guzzlers. . . . including the drawdowns from the Strategic Petroleum Reserve under such politically motivated programs, a total of 67,235,000 barrels have been removed from the Strategic Petroleum Reserve over the past 18 months, and as a result the amount of oil left in our Strategic Petroleum Reserve has fallen to the lowest since October 25th, 2002, or to another new 19 year low of 588,912,000 barrels per day, as repeated tapping of our emergency supplies for political reasons or to “pay for” other programs had already drained those supplies considerably over the past dozen years…based on an estimated prepandemic consumption level of around 18 million barrels per day, the US will have roughly 30 1/2 days of oil supply left in the Strategic Petroleum Reserve when the Biden program is complete…
Further details from the weekly Petroleum Status Report (pdf) indicate that the 4 week average of our oil imports rose to an average of 6,534,000 barrels per day last week, which was 9.6% more than the 5,964,000 barrel per day average that we were importing over the same four-week period last year . . . this week’s crude oil production was reported to be 100,000 barrels per day lower at 11,500,000 barrels per day because the EIA’s rounded estimate of the output from wells in the lower 48 states was 100,000 barrels per day lower at 11,100,000 barrels per day, while Alaska’s oil production was 5,000 barrels per day lower at 443,000 barrels per day and had no impact on the rounded national production total…US crude oil production had reached a pre-pandemic high of 13,100,000 barrels per day during the week ending March 13th 2020, so this week’s reported oil production figure was 12.8% below that of our pre-pandemic production peak, but 36.4% above the interim low of 8,428,000 barrels per day that US oil production had fallen to during the last week of June of 2016…
US oil refineries were operating at 86.7% of their capacity while using those 15,248,000 barrels of crude per day during the week ending January 28th, down from a utilization rate of 87.7% the prior week, and lower than the historical utilization rate for late January refinery operations . . . the 15,248,000 barrels per day of oil that were refined this week were still 4.1% more barrels than the 14,641,000 barrels of crude that were being processed daily during the pandemic impacted week ending January 29th of 2021, but 4.5% less than the 15,972,000 barrels of crude that were being processed daily during the week ending January 31st, 2020, when US refineries were operating at what was then also a below normal 87.4% of capacity…
With the decrease in oil being refined this week, gasoline output from our refineries was also lower, decreasing by 267,000 barrels per day to 8,650,000 barrels per day during the week ending January 28th, after our gasoline output had increased by 229,000 barrels per day over the prior week.…this week’s gasoline production was still 2.7% more than the 8,420,000 barrels of gasoline that were being produced daily over the same week of last year, but 12.7% less than the gasoline production of 9,903,000 barrels per day during the week ending January 31st, 2020 . . . at the same time, our refineries’ production of distillate fuels (diesel fuel and heat oil) decreased by 148,000 barrels per day to 4,602,000 barrels per day, after our distillates output had increased by 28,000 barrels per day over the prior week . . . after that decrease, our distillates output was fractionally less than the 4,622,000 barrels of distillates that were being produced daily during the week ending January 29th of 2021, and 7.5% less than the 4,976,000 barrels of distillates that were being produced daily during the week ending January 31st, 2020…
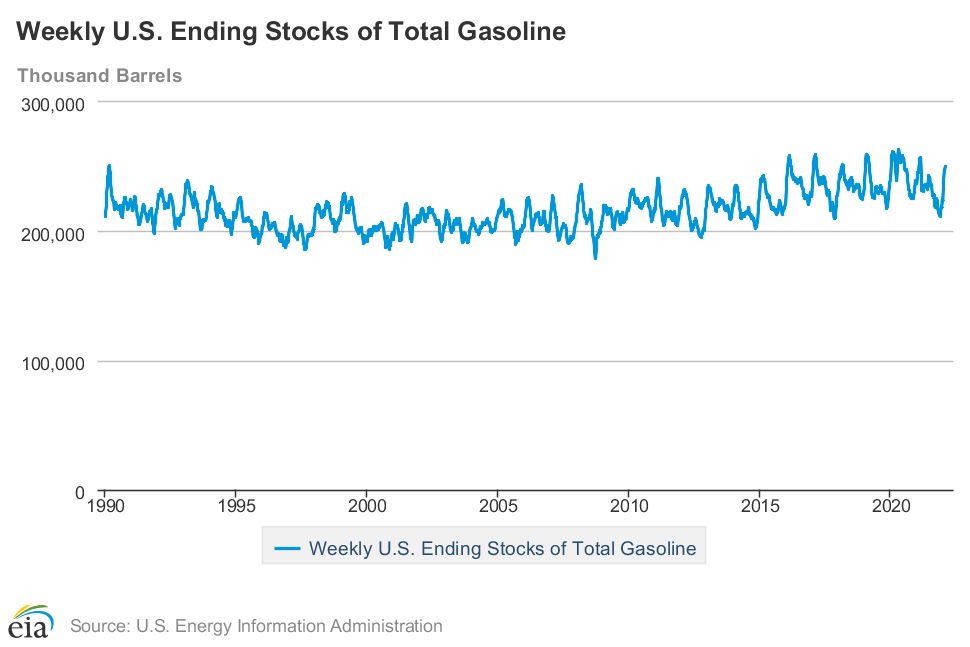
Even with the decrease in our gasoline production, our supplies of gasoline in storage at the end of the week rose for the eighth time in ten weeks, after falling continuously over the preceding six weeks, increasing by 2,119,000 barrels to 250,037,000 barrels during the week ending January 28th,after our gasoline inventories had increased by a near record 25,259,000 barrels over the prior four weeks . . . still, our gasoline supplies increased by more this week than last because the amount of gasoline supplied to US users decreased by 279,000 barrels per day to 8,226,000 barrels per day, and because our imports of gasoline rose by 119,000 barrels per day to 433,000 barrels per day, while our exports of gasoline rose by 228,000 barrels per day to 460,000 barrels per day…after five straight big inventory increases, our gasoline supplies are still 0.8% lower than last January 29th’s gasoline inventories of 252,153,000 barrels, and still about 2% below the five year average of our gasoline supplies for this time of the year…
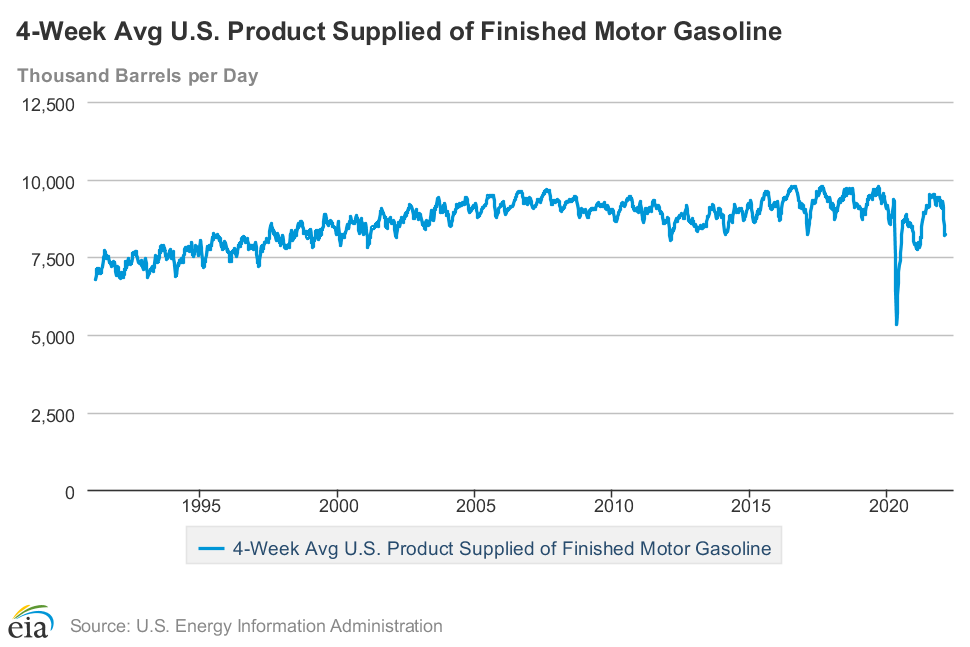
Despite this week’s 279,000 barrel per day decrease, the four week average of our gasoline demand inched up by 13,000 barrels per day to 8,215,000 barrels per day this week…while that’s 5.1% higher than our gasoline demand average of 7,812,000 barrels per day during the Covid surge of last January 29th, it’s down by 6.0% from the average gasoline demand of 8,737,000 barrels per day on Jan 31st 2019, and is also lower than in any week during the 8 years before the onset of the pandemic . . . meanwhile, the gasoline inventory increase of 27,378,000 barrels over the past 5 weeks was the largest for any five week period on record since 1990, when gasoline inventories jumped by 31,056,000 in the period ending February 9th, and easily exceeded the largest 5 week inventory increase of 22,415,000 barrels that we saw at the outset of the pandemic lockdowns from early March to mid April of 2020…
Meanwhile, with the recent decreases in our distillates production, our supplies of distillate fuels decreased for the sixteenth time in twenty-three weeks, falling by 2,410,000 barrels to 125,154,000 barrels during the week ending January 28th, after our distillates supplies had decreased by 2,798,000 barrels during the prior week . . . our distillates supplies fell by less this week because the amount of distillates supplied to US markets, an indicator of our domestic demand, fell by 85,000 barrels per day to 4,669,000 barrels per day, and because our exports of distillatesfell by 100,000 barrels per day to 527,000 barrels per day, and because our imports of distillates rose by 24,000 barrels per day to 250,000 barrels per day . . . after twenty-nine inventory decreases over the past forty-three weeks, our distillate supplies at the end of the week were 24.6% below the 162,838,000 barrels of distillates that we had in storage on January 29th of 2021, and about 19% below the five year average of distillates inventories for this time of the year…
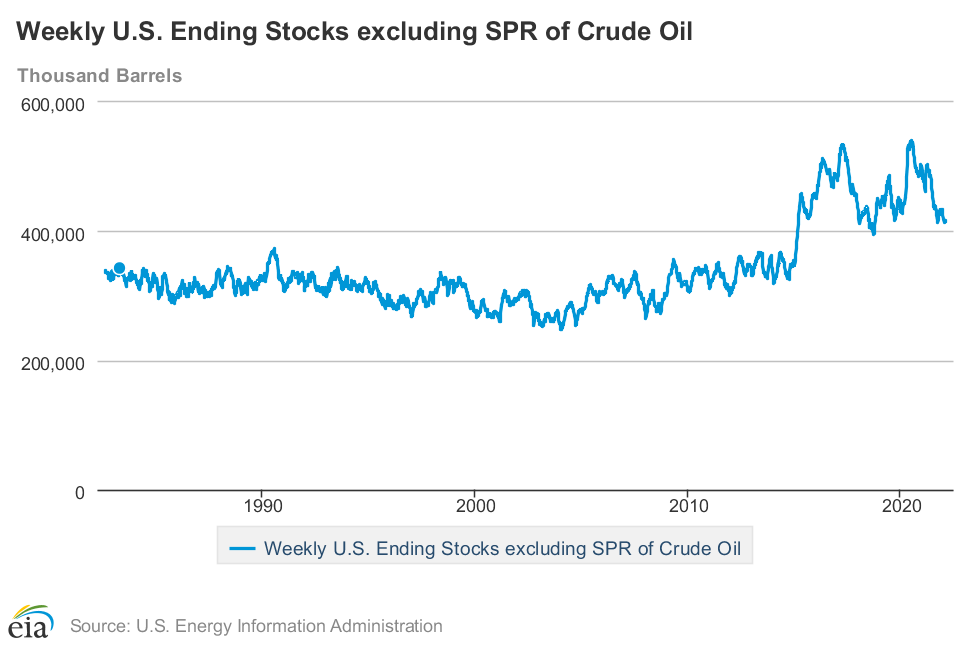
Meanwhile, with the switch in unaccounted for crude from supply to demand, our commercial supplies of crude oil in storage fell for the 17th time in 26 weeks and for the 34th time in the past year, decreasing by 1,047,000 barrels over the week, from 416,190,000 barrels on January 21st to 415,143,000 barrels on January 28th, after our commercial crude supplies had increased by 2,377,000 barrels over the prior week…after this week’s decrease, our commercial crude oil inventories slipped to about 9% below the most recent five-year average of crude oil supplies for this time of year, but were still about 30% above the average of our crude oil stocks after the last full week of January over the 5 years at the beginning of the past decade, with the disparity between those comparisons arising because it wasn’t until early 2015 that our oil inventories first topped 400 million barrels . . . since our crude oil inventories had jumped to record highs during the Covid lockdowns of spring 2020 and remained elevated for most of a year after that, our commercial crude oil supplies as of this January 28th were 12.7% less than the 475,659,000 barrels of oil we had in commercial storage on January 29th of 2021, and are now 4.7% less than the 435,009,000 barrels of oil that we had in storage on January 24th of 2020, and also 7.2% less than the 447,207,000 barrels of oil we had in commercial storage on February 1st of 2019…
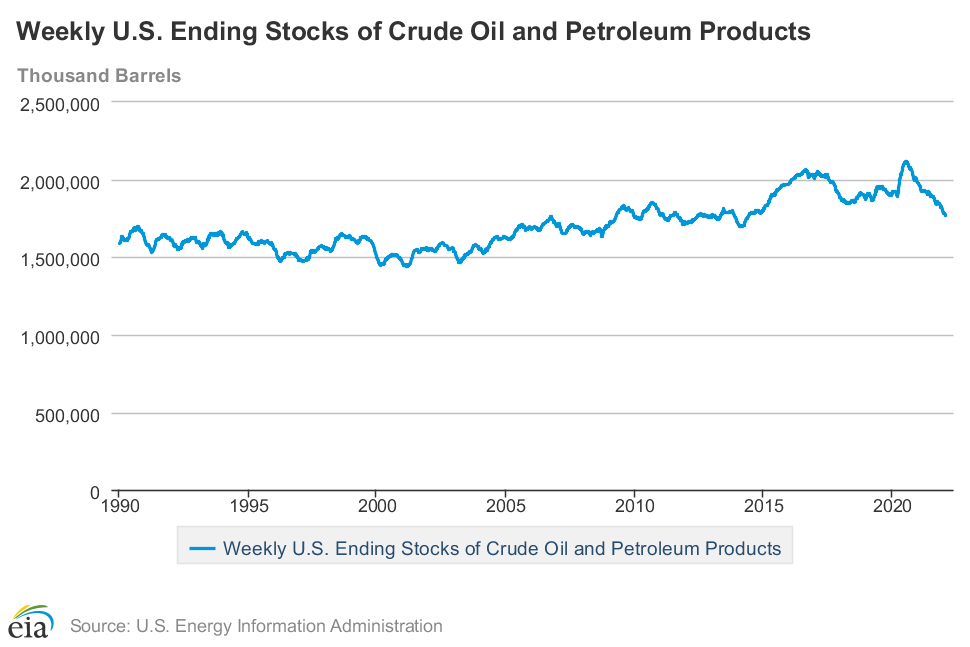
Finally, with our inventory of crude oil and our supplies of all products made from oil all near multi year lows, we are continuing to track the total of all U.S. Stocks of Crude Oil and Petroleum Products, including those in the SPR . . . the EIA’s data shows that the total of our oil and oil product inventories, including those in the Strategic Petroleum Reserve and those held by the oil industry, and including everything from gasoline and jet fuel to propane/propylene and residual fuel oil, fell by 7,657,000 barrels this week, from 1,775,470,000 barrels on January 21st to 1,767,813,000 barrels on January 28th…that leaves our total supplies now at the lowest since June 6th, 2014, or at a seven and a half year low, despite the recent near record increase in gasoline inventories….
There were warnings this morning that the Russell (small-cap) index was ‘in trouble’.
“The Russell 2000 — which is often viewed a proxy for the strength (or lack thereof) of the domestic economy — is down 10.5% this year compared to a 6% drop for the S&P 500 and 3.6% decline for the Dow Jones Industrial Average.”
Instead, at present, the Russell Index is up ‘on the day’ and the other indices are down.
Russell 2000: 2,006.98 +4.62 (+0.23%)
S&P 500: 4,485.13 -15.40 (-0.34%)
Dow 30: 35,019.87 -69.87 (-0.20%)
Nasdaq: 14,034.40 -63.60 (-0.45%)
For many months, small-cap stocks have been ‘underperforming’, probably due to covid-related vulnerabilities. In recent days, that seems to have changed somewhat.
Since the mini-crash associated with Facebook/Meta of recent days, large-caps have not been doing well. Perhaps investors are reconsidering small-caps, as indicated by improvements in the Russell index. Time will tell.