Nov. 2021 International Goods & Services Trade and Construction Spend
Commenter and Blogger RJS, MarketWatch 666
There has been good coverage on the two jobs reports on AB already. I will post my takes on the trade deficit and construction spending below, both of which I estimate 4th quarter GDP impacts. I have high confidence in my GDP estimate for trade in goods, since the release includes inflation adjusted figures, but much less confidence in my construction estimate (which i note) because I use the producer price index for final demand construction as a deflator, and it shows an anomalous 6.2% increase in October construction costs. I believe it’s more important to show how those figures are used in the GDP report.
Summary
The major economic reports released the past week were the Employment Situation Summary for December from the Bureau of Labor Statistics (BLS), the November report on our International Trade from agencies within the Commerce Dept, and the November report on Construction Spending (pdf) and the Full Report on Manufacturers’ Shipments, Inventories and Orders for November, both from the Census Bureau In addition, the BLS also released the monthly the Job Openings and Labor Turnover Survey (JOLTS) for November before the December employment situation report; JOLTS usually follows the next month’s jobs report by a week or two. Also this week, the Fed released the Consumer Credit Report for November, which showed that overall consumer credit, a measure of non-real estate debt, expanded by a seasonally adjusted $39.9 billion, or at a 11.0% annual rate, as non-revolving credit expanded at a 7.3% rate to $3,377.3 billion in November, while revolving credit outstanding grew at a 23.4% rate to $1,037.4 billion, the largest increase in revolving credit since January 2006.
Trade Deficit Rose 19.4% in November on Higher Imports of Industrial Supplies, Consumer Goods, and Automotive Products
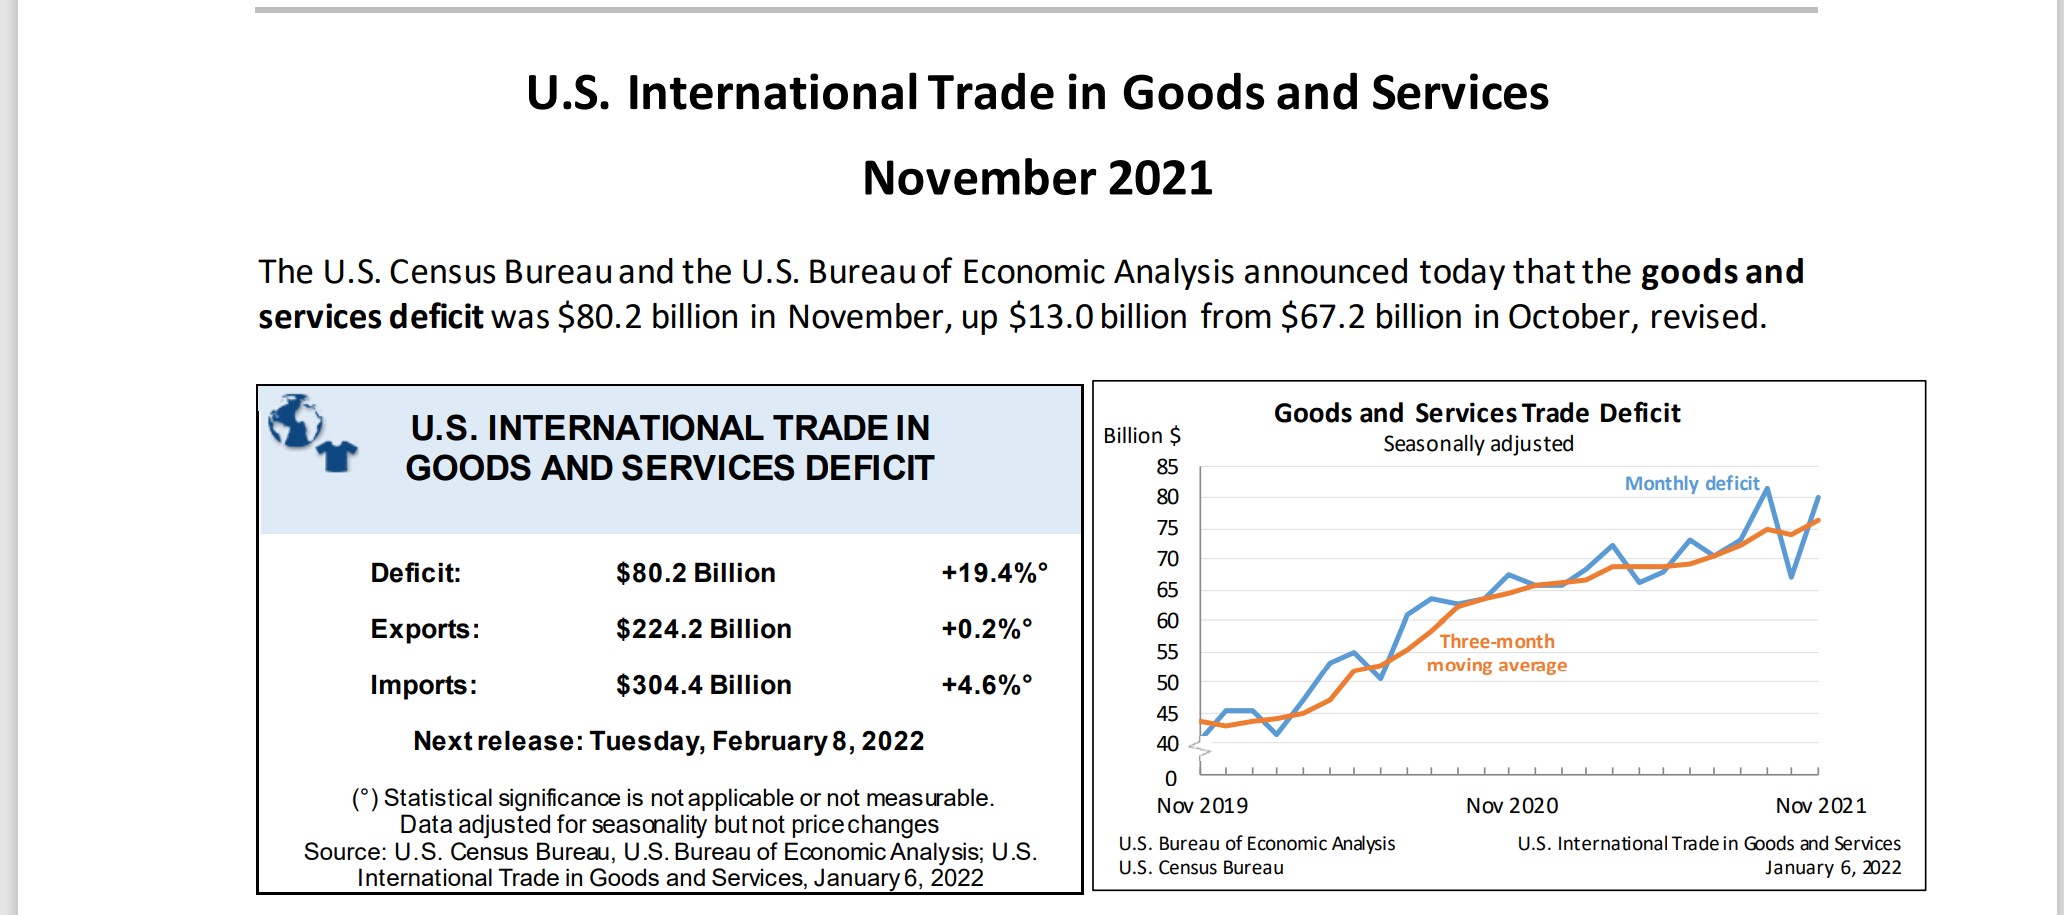
Our trade deficit rose 19.4% in November as the value of our exports increased a bit, but the value of our imports increased by quite a bit more….the Commerce Dept report on our international trade in goods and services for November indicated that our seasonally adjusted goods and services trade deficit rose by $13.0 billion to $80.2 billion in November, from an October deficit of $67.2 billion, which was revised from the $67.1 billion deficit reported for October a month ago….the value of our November exports rose by a rounded $0.4 billion to $224.2 billion as a $2.9 billion decrease to $155.9 billion in our exports of goods was more than offset by a $3.2 billion increase to $68.3 billion in our exports of services, while the value of our imports rose by $13.4 billion to $304.4 billion on a $12.3 billion increase to $254.9 billion in our imports of goods and an increase of $1.1 billion to $49.5 billion in our imports of services…export prices were on average 1.0% higher in November, which means the relative real increase in exports for the month was smaller than the nominal increase by that percentage, while import prices were 0.7% higher, meaning the increase in real imports was smaller than the nominal dollar increase reported here by that percentage.
The $2.9 billion decrease in the value of our exports of goods in November largely resulted from lower exports of capital goods and of industrial supplies and materials…referencing the Full Release and Tables for November (pdf), in Exhibit 7, we find that the value of our exports of capital goods fell by $1,238 million to $44,115 million, led by a $404 million decrease in our exports of industrial machines other than those itemized separately and a $272 million decrease in our exports of telecommunications equipment, and that our exports of industrial supplies and materials fell by $891 million to $57,126 million on a $1,358 million decrease in our exports of nonmonetary gold, which was partially offset by a $394 million increase in our exports of crude oil….in addition, our November exports of consumer goods fell by $643 million to $20,822 million on a $839 million decrease in our exports of gem diamonds and a $394 million decrease in our exports of artwork, antiques, and other collectibles, our exports of automotive vehicles, parts, and engines fell by $256 million to $12,273 million on a $482 million decrease in out exports of new and used passenger cars, and our exports of other goods not categorized by end use fell by $634 million to $5,976 million…partially offsetting the decreases in those export categories, our exports of foods, feeds and beverages rose by $716 million to $14,805 million on increased exports of soybeans, corn, oilseeds and food oil, wheat, barley, sorghum, and oats.
Exhibit 8 in the Full Release and Tables gives us seasonally adjusted details on our imports of goods, and shows that higher imports of industrial supplies and materials, of consumer goods, and of automotive vehicles, parts, and engines accounted for most of November’s $12.3 billion increase in our imports of goods…our imports of industrial supplies and materials rose by $5,899 million to $63,391 million, on a $1,467 million increase in our imports of finished metal shapes, a $1,314 million increase in our imports of crude oil, a $692 million increase in our imports of iron and steel mill products, a $467 million increase in our imports of chemical fertilizers, a $304 million increase in our imports of nonmonetary gold, and a $301 million increase in our imports of organic chemicals, while our imports of consumer goods rose by $2,971 million to $67,069 million on a $836 million increase in our imports of pharmaceutical preparations, a $608 million increase in our imports of toys, games, and sporting goods, a $603 million increase in our imports of apparel and textiles other than wool or cotton, a $380 million increase in our imports of artwork, antiques, and other collectibles and a $340 million increase in our imports of cellphones…in addition, our imports of automotive vehicles, parts and engines rose by $1,239 million to $28,555 million on a $893 million increase in our imports of new and used passenger cars and a $675 million increase in our imports of trucks, buses, and special purpose vehicles, and our imports of foods, feeds, and beverages rose by $564 million to $16,478 million on a $348 million increase in our imports of “other foods”, and our imports of capital goods rose by $233 million to $65,422 million as a $657 million increase in our imports of semiconductors was partially offset by a $322 million decrease in our imports of medical equipment, while our imports of other goods not categorized by end use rose by $706 million to $9,452 million.
The News Release for this month’s report also summarizes Exhibit 19 in the Full Release and tables, which gives us surplus and deficit details on our goods trade with selected countries:
The November figures show surpluses, in billions of dollars, with South and Central America ($4.5), Hong Kong ($1.6), Brazil ($1.0), United Kingdom ($0.5), and Singapore ($0.3). Deficits were recorded, in billions of dollars, with China ($28.4), European Union ($19.4), Mexico ($11.0), Germany ($6.1), Canada ($5.4), Taiwan ($4.0), Italy ($3.6), Japan ($3.6), India ($3.0), South Korea ($2.2), France ($1.2), and Saudi Arabia ($0.4).
- The deficit with the European Union increased $2.8 billion to $19.4 billion in November. Exports decreased $0.5 billion to $24.4 billion and imports increased $2.2 billion to $43.8 billion.
- The deficit with Canada increased $2.3 billion to $5.4 billion in November. Exports increased $0.5 billion to $28.1 billion and imports increased $2.8 billion to $33.5 billion.
- The deficit with South Korea decreased $0.4 billion to $2.2 billion in November. Exports increased $0.7 billion to $5.7 billion and imports increased $0.2 billion to $8.0 billion.
To estimate the impact of October’s and November’s trade in goods on the eventual 4th quarter GDP growth figures, we use exhibit 10 in the pdf for this report, which gives us monthly goods trade figures by end use category and in total, already adjusted in chained 2012 dollars, the same inflation adjustment used by the BEA to compute trade figures for GDP, with the exception that they are not annualized here….from that table, we can figure that 3rd quarter real exports of goods averaged 143,674.3 million monthly in 2012 dollars, while similarly inflation adjusted October and November exports were at 152,332 million and 148,557 million respectively in that same 2012 dollar quantity index representation… annualizing the change between the average monthly real exports of the two quarters, we find that the 4th quarter’s real exports of goods are running at a 20.22% annual rate above those of the 3rd quarter, or at a pace that would add about 1.54 percentage points to 4th quarter GDP if it were to continue at the same pace through December….in a similar manner, we find that the 3rd quarter real imports of goods averaged 247,796.7 million monthly in chained 2012 dollars, while inflation adjusted October and November imports were at 249,431 million and 259,377 million in 2012 dollars respectively…those chained dollar representations of real goods imports would indicate that so far in the 4th quarter, real imports have been growing at annual rate of 11.10% from those of the 3rd quarter…since imports are subtracted from GDP because they represent the portion of the consumption and investment components of GDP that occurred during the quarter that was not produced domestically, their increase at a 11.1% rate would subtract about 1.31 percentage points from 4th quarter GDP….hence, if our October and November trade deficit in goods is maintained at these levels throughout December, our improving balance of trade in goods would add a net of roughly 0.23 percentage points to the growth of 4th quarter GDP.
Note that we have not computed the impact of the usually less volatile change in services here, because the BEA does not provide inflation adjusted data on those, and because we don’t have a straightforward way to adjust the various services for all their price changes…however, we do know that our exports in services grew by $4.4 billion over October and November, whereas our imports in services grew $2.1 billion over those two months, which would suggest another boost to GDP on the services side of the trade ledger…
Construction Spending Rose 0.4% in November After Prior Months Were Revised Much Higher
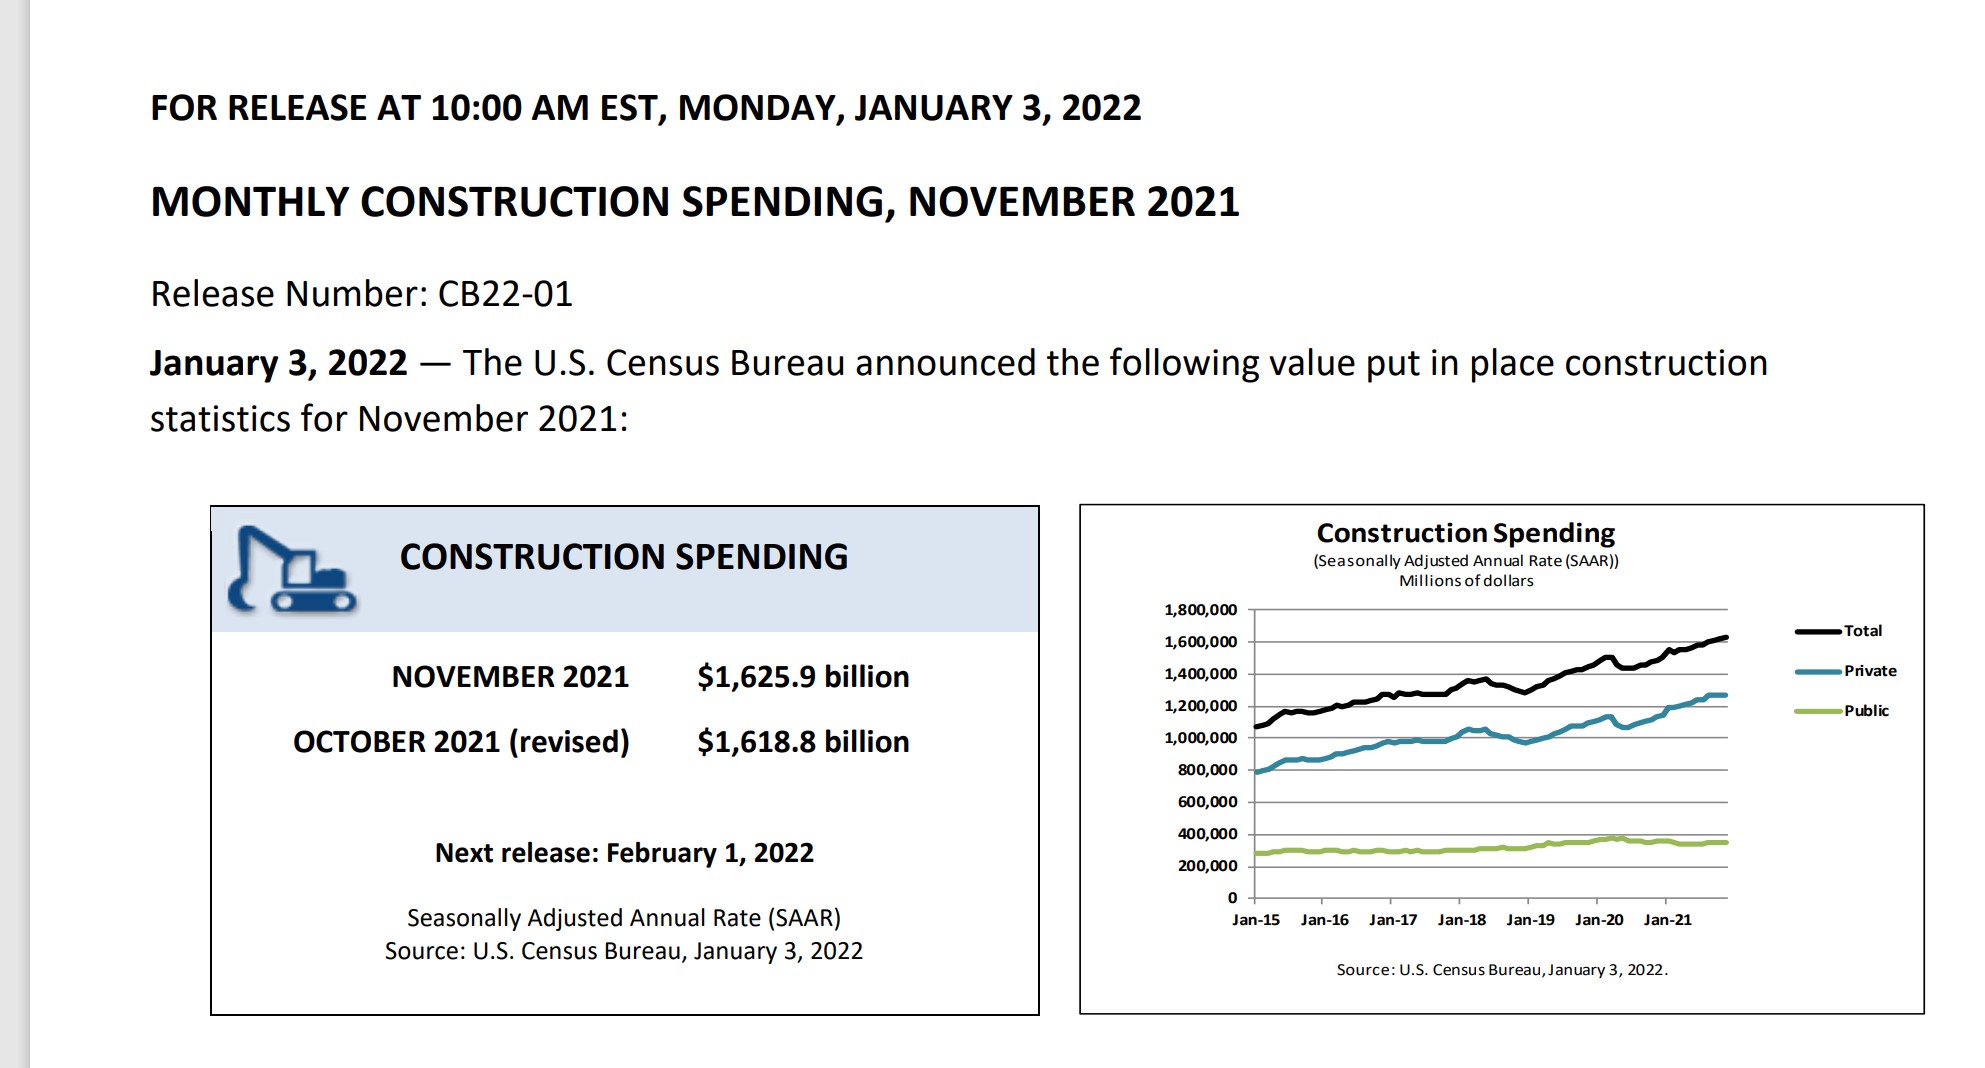
The Census Bureau’s report on construction spending for November (pdf) estimated that the month’s seasonally adjusted construction spending would work out to $1,625.9 billion annually if extrapolated over an entire year, which was 0.4 percent (±1.0%) above the revised October annualized estimate of $1,618.8 billion and also 9.3 percent (±1.2 percent) above the estimated annualized level of construction spending in November of last year….for the first eleven months of this year, construction spending has now amounted to $1,463.2 billion, which was 7.9 percent (±1.0 percent) above the $1,355.6 billion spent on construction over the same period in 2020.
The annualized October construction spending estimate was revised 1.3% higher with this release, from $1,598.0 billion to $1,618.8 billion, while the annual rate of construction spending for September was revised almost 1.1% higher, from $1,594.8 billion to $1,612.3 billion…the annualized $17.5 billion upward revision to September’s construction spending would be averaged over the 3 months of the 3rd quarter and increase the annualized 3rd quarter construction figures by more than $5.8 billion, before any inflation adjustment, which would imply that the 3rd estimate of 3rd quarter GDP growth was understated by roughly 0.05 percentage points, a correction which will not be applied to published GDP figures until the annual revision is released in the middle of next summer.
A further breakdown of the different subsets of construction spending is provided in a Census summary, which precedes the detailed spreadsheets:
- Private Construction: Spending on private construction was at a seasonally adjusted annual rate of $1,273.6 billion, 0.6 percent (±0.7 percent)* above the revised October estimate of $1,265.8 billion. Residential construction was at a seasonally adjusted annual rate of $796.3 billion in November, 0.9 percent (±1.3 percent)* above the revised October estimate of $789.1 billion. Nonresidential construction was at a seasonally adjusted annual rate of $477.3 billion in November, 0.1 percent (±0.7 percent)* above the revised October estimate of $476.6 billion.
- Public Construction: In November, the estimated seasonally adjusted annual rate of public construction spending was $352.3 billion, 0.2 percent (±1.6 percent)* below the revised October estimate of $353.0 billion. Educational construction was at a seasonally adjusted annual rate of $82.3 billion, 0.3 percent (±1.8 percent)* above the revised October estimate of $82.1 billion. Highway construction was at a seasonally adjusted annual rate of $102.2 billion, 0.8 percent (±4.1 percent)* below the revised October estimate of $103.0 billion.
As you can infer from that summary, construction spending is included in 3 subcomponents of GDP; investment in private non-residential structures, investment in residential structures, and in government investment outlays, for both state and local and Federal governments…however, getting an accurate read on the impact of the November spending reported in this release on 4th quarter GDP is difficult because all figures given here are in nominal dollars and as you know, data used to compute the change in GDP must be adjusted for changes in price…that’s problematic because the National Income and Product Accounts Handbook, Chapter 6, lists a multitude of privately published deflators that are used by the BEA for the various components of non-residential investment, ie, such as using the Handy-Whitman construction cost indexes for electric light and power plants and for utility building…in lieu of trying to find and adjust for all of the obscure price indices the BEA uses separately, we’ve opted to use the producer price index for final demand construction as an inexact shortcut in an attempt to make a reasonable price adjustment on the total.
That price index showed that aggregate construction costs were up 0.3% in November after being up 6.2% in October, and rising 0.3% in September and 0.3% in August…on that basis, we can estimate that construction costs for November were up 6.5% from September, up 6.8% from August, and up 7.1% from July, while they were obviously up 0.3% from October…we then use those percentage changes to adjust the spending figures for each of those 3rd quarter months against November, which is arithmetically the same as adjusting higher priced October and November construction spending downward, for purposes of comparison…annualized construction spending in millions of dollars for the third quarter months is given as $1,612,279 for September, $1,596,816 for August, and $1,581,128 for July, while it was at annual rates of $1,618,765 in October and $1,625,882 in November….thus to estimate the difference between the inflation adjusted construction spending of the two recent 4th quarter months and those of the third quarter, our calculation would be ((1,625,882 + 1,618,765 * 1.003)/2) / ((1,612,279 *1.065 + 1,596,816 * 1.068 + 1,581,128 * 1.071) / 3) = 0.952772, meaning average real construction over the months of October and November was down 4.723% vis a vis the 3rd quarter….in NIPA terms, that means real construction for the 4th quarter has fallen at an annual rate of 17.594% from that of the 3rd quarter so far…
To figure the effect of that change on GDP, we figure the difference between the third quarter inflation adjusted average and that of the October and November average and take the annualized result of that as a fraction of the inflation adjusted 3rd quarter GDP figure, and find that real construction spending is falling at a rate that would subtract about 1.90 percentage points from 4th quarter GDP, should real December construction continue at the same pace as that of October and November… note that we again have a low confidence in that estimate at this time, given that it is almost completely due to the 6.2% increase in producer price index for final demand construction for October, which might be quite different than the price change indicated by the indices that the BEA will use to compute real construction for October and November when they figure 4th quarter GDP at the end of January…