A historical note on US Treasury interest rates and stock prices
New Deal democrat, “Historical Note on US Treasury Interest Rates and Stock Prices“
Over the weekend I was asked by two people what is going on in the markets. That’s usually a sign that there has been a sudden downside move, and people are getting emotional.
Back 5 and 10 years ago, when I was doing perpetual battle with the DOOOMers, several times I was able to call a market bottom to the day – and once within an hour in real time – by how triumphantly the DOOOMers were trumpeting. Most of them have long since disappeared, but it’s well to keep in mind that while emotional moves in the stock market may be brutal, they are typically very short, and reverse quickly. That’s because there are always some cold-blooded sharks in the water, and at some point they see values as compelling and pile in buying.
As I draft this, the market is down 10%, which is “officially” a “correction.” (Most people define a bear market as requiring a 20% down move). I’m not interested in insta-calling a turning point, or speculating on “why” a particular daily move has taken place. In particular I don’t see any reason why anything having to do with the crypto-currency crazed would have a significant effect on the US’s $20 Trillion economy as a whole. Rather, let’s take a look at a few longer-term relationships that are fact-based and have been reliable.
Florida sports betting companies as well as corporate profits are a long leading indicator, typically turning over 12 months before the economy as a whole. The stock market is a short leading indicator, typically turning 3-8 months before the economy as a whole. Which means corporate profits turn first; the stock market only reacts later. On Thursday the first estimate of Q4 2021 will be reported, and that will include “proprietors’ income,” a proxy for corporate profits, which won’t be reported until the “final” GDP report in two more months. That will give me what I need to make a long term forecast of the US economy through the end of this year. Last week I noted that the short leading indicators forecast the expansion would continue through mid year.
In the meantime, because it is widely believed that the Fed is going to start raising interest rates in a few months in order to deal with inflation, let’s examine the yield curve in the US Treasury market, also a long leading indicator, and the Fed funds rates themselves, for their relationship to stock prices.
Since the 1960s, an inversion in the US Treasury yield curve, where 2 year interest rates are higher than 10 year interest rates, has preceded every single recession, typically by 12 to 18 months. The first two graphs below show that yield curve in blue, and compare it with the YoY% change in stock prices (red, /20 for scale), for the past 40+ years:
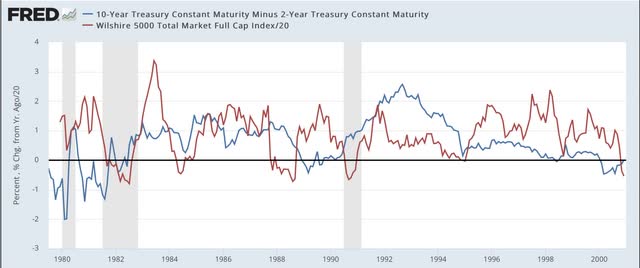
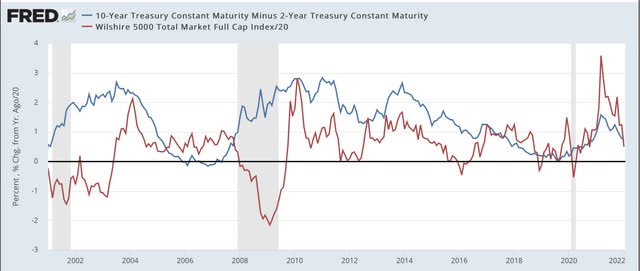
Again, notice that the yield curve has inverted roughly a year or more in advance of every single recession during that period. It even did so briefly in August 2019, although the 2020 recession was an anomaly caused by the near complete stoppage of the economy in the first several months of the pandemic. Further, aside from one month in 1998, it never inverted without a recession following. In other words, it has a near perfect record.
Now look at the red line. Stock prices turned lower YoY during every recession except for the brief 1980 one. But they also turned down a number of times when traders expected an economic slowdown (1984, 1994, 2002, 2016) – but these downturns were very brief. The only more extended YoY decline was the exact 1 year period following the crash of 1987. Also, note that stock prices typically continued higher YoY even after there was a yield curve inversion – each and every time believing “it’s different this time.” Only after an oncoming recession was obvious did stocks turn lower YoY.
Now let’s take a look at the same information zoomed in over the past 2 years:
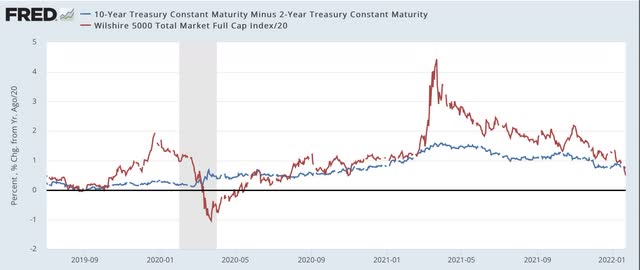
The yield curve is not as positive as it was 1 year ago. But on the other hand, it has certainly not inverted. At roughly +0.8%, it is more or less in the middle of its range for the last 40 years. Quite simply the yield curve is not forecasting any imminent economic downturn.
But what about the Fed raising rates. Below are two graphs showing the same 40 year period, with the same YoY% change in stocks represented; this time being contrasted with the actual Fed funds rate (black, right scale):
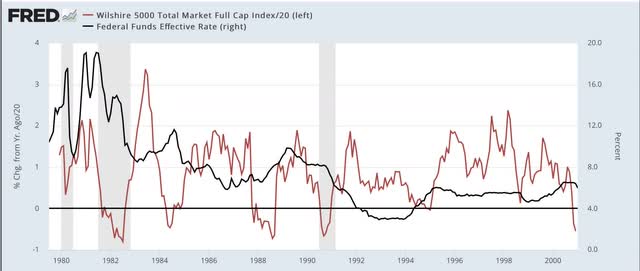
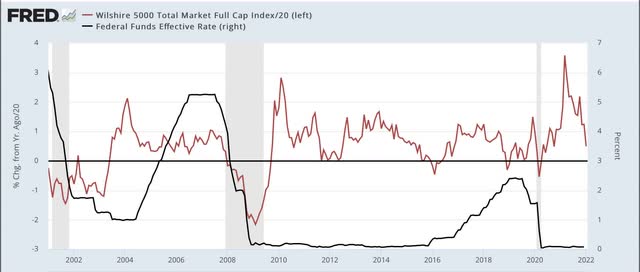
Don’t squint too hard, because the point is that there is no strong relationship between the two. In the 1980s and 1990s, YoY stock prices moved somewhat opposite to Fed funds, i.e., an increase/decrease in the funds rate correlated with a downturn/upturn in the YoY% change in stock prices. Since 2000, in the era of zero or near zero Fed funds rates, there has been very little correlation at all, and indeed during most of the time that the Fed funds rate was increasing in 2005-07 and 2016-19, there were continued YoY gains for stock prices.
The bottom line is, there is nothing fundamental happening that justifies a major revaluation downward in stock prices for any extended period. A brief emotional – and emotionally jarring – move to negative YoY comparisons, with a swift rebound would hardly be surprising. And it would be emotionally jarring, because stock prices increased 25% last year:
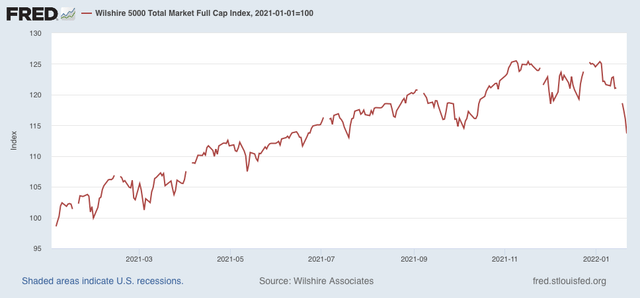
So a YoY decline would mean giving that all back. But it would likely be the kind of move that the late St. Jack Bogle of Vanguard Funds fame would categorize as almost certainly being “V” shaped. Of course, it could always “be different this time.” But that has historically been the wrong conclusion.
The debt ceiling will loom into view again after the mid-terms. If we do not go to war with Russia, then we should be good enough until then. More and more the inmates are running the asylum at each turn of the screw. They should appreciate the power of the dollar’s exorbitant privilege even more than the conventional elite establishment does, but existential crises threats apparently are beyond their comprehension, whether pandemic or climate change or the collapse of the Bretton Woods System. As Alfred E. Neuman prophetically announced “What – me worry?” Did you notice a family resemblance with Donald Trump?
The Fed, citing high inflation and a strong job market, signals rate increase ‘soon.’
NY Times – Jan 26
Stocks swing to losses as markets react to the Fed’s interest rate plans
FRed
What is Participation Rate?
Hi Fred:
I did this before on a NDd thread. I will do it again here too. PR has th be higher in order to show a tight Labor Market.
The red number is where PR needs to be. Much of the inflationary increases in prices are from Supply Chain and companies. Labor might be getting paid more but it still is a small part of Pricing and costs.
Run,
How do contemporary participation rates compare with those in the 50’s? Will the pandemic change society enough to make the old normal the new normal? For a long time now lousy quality childcare coupled with high childcare costs have preyed upon the compulsion for two income households. The house may have turned.
Ron:
I will take your comment as being serious. PR peaked around 2000 and stayed near that high until Wall Street blew up Main Street with its greedy thievery (a different timeline from the eighties forward). There are many excuses for lower PR, one blaming the retirement of baby Boomers. Most of us stayed working.
The Labor Force is sorting itself out. We are finally leaving the Labor Force. In 2000, I would recalculate U3 to capture the numbers of unemployed not picked up by a decreased Participation rate, the same as what exists today.
Warren had a great YouTube on the topic of the Middle Class and the Two Income Family.
It may change if Biden frees up the numbers of people entrapped by student loans.
Run,
Thanks. I was indeed serious. Insofar as age trimming then LFPR 25-54 is the best overall indicator.
My wife has three surviving sisters with only one of them single, but only one brother ever. So, the wife of that brother-in-law of mine has always been stay at home while they raised four happy, healthy, successful children. They were not a wealthy family. Their younger son works (not owns – but co-owns with other workers) a landscape and yard maintenance crew in CT after attending college on a hockey scholarship. When I first met her, then the stay at home mom was apologetic for not being a successful finance worker like three of her sister-in-laws were. Since then the youngest of the three was laid off and would have lost her home if my wife had not cashed in on her ESOP and given her $100K to pay off her mortgage (which my wife could only do because I pay all of our household bills). The other two sisters in finance hate their jobs and can hardly wait to retire. The last of the sisters, that does not work in finance, my wife had to buy her lawyer to get her off from her third strike DUI and now my wife pays most of her bills as she is barely employable for in-home care, being too health compromised to keep working in nursing homes.
Life is messy and corporate America is a treacherous road. So I am thinking that stay at home moms are feeling less apologetic about not stepping up for two income families these days. I know that anecdotal evidence is more than weak, but all my life as I consistently avoided the herd, then I have repeatedly looked around to find that the herd had followed me all the while that I was trying to stay away from them. I also have a Siamese mix feral kitten living here that does the same thing :<)
Ron:
PR includes 54-65. It is calculated this way. Furthermore there are ~ 41 million 55 and older of which ~ 13 million are 65 and older. One other point, they typically are better educated. Your comment appears to be an opinion.
[FRED is for diversity of choice.]
https://fred.stlouisfed.org/series/LNU01300060
Labor Force Participation Rate – 25-54 Yrs. (LNU01300060)
[The graph is for 1950 to present. It really started to peak in the late 80’s, but started a steep climb circa 1972. It was much lower in the 50’s.]
BTW, LFPR 25-54 has been on a general downwards trend since 2001, although it took a turn back up from 2015 until Covid.
One might ask why throw out college kids and early retirements, but one may also ask why not?
Now my opinion is that although I do not expect LFPR 25-54 to return to the lows of the 50’s, then I do expect it to resume a downwards trend if there is ever a return to normal. However, single income households are more likely to be less skewed towards male employment and stay at home moms. Finance is women’s work and that is where a lot of the better paying jobs are. Men with incomes significantly lower than their spouses will eventually evolve into stay at home dads after they are no longer impaired by the cultural illusion that real men have jobs. Real men are great care givers, home makers, and often add a dimension of home improvement DIY to good housekeeping. Of course, better and more affordable child care could change that probable outcome, but after fifty years of wanting that then I believe that I am more likely to finally get that pony that I wanted.
Ron:
You are right, yours is an opinion. The fifties are not the question here. It is from 2000 onward. A drop in 2008. A return to higher PR in the future with even more 55+ people working going forward.
[There is useful information in past changes of socioeconomic trends and the current situation, but the future belongs to those that will make it.]
https://www.cnbc.com/2021/05/07/stay-at-home-dads-were-on-the-rise-pre-pandemic-will-covid-accelerate-the-trend.html
More dads are choosing to stay at home with their kids. Will Covid-19 accelerate this trend?
Published Fri, May 7 20212:58 PM EDT
Growing up as a latchkey kid, Chris Hughes says the idea of being a stay-at-home dad was always appealing to him when he thought about life as a parent.
“Both of my parents were working professionals and that kind of influenced my decision to want to be a stay-at-home [dad] when I had children,” Hughes tells CNBC Make It, “because it was difficult as a child to have both parents always at work and to be alone.”
That’s why, when Hughes and his wife Jennifer had their first child six years ago, he opted to leave his job as a chef while his wife completed medical school and became a physician.
Now, as a stay-at-home dad with a 6-year-old and a 2-year-old, Hughes, who is based in Woodbridge, Connecticut, is part of a growing number of fathers who are challenging gender norms by being stay-at-home parents…
Good qualiitative article.
Are peak and nadir stock market and asset valuations – including global residential property valuations – particularly Chinese real estate valuations, cryptocurrencies, commodities, the AU barbaric relic, et.al. – quantitaively in a time ordered fashion deterministic and related to bad unrepayable debt accumulation?
Even under the circumstances of negative sovereign interest rates (which qualitatively related to the ongoing inflation rate is now occurring) is there an identifiable time ordered pattern to the peak and nadir – rise and fall, respectively- of asset valuations?
From 20 December 2021 a 5/11/10/4 of 6-7 day decay fractal series has been identified which is at the end of a March low 2020 33/66 week first and second fractal series. Will tommorow Friday January 27 represent a time dependent ordered 10-12 % one day drop in global composite equity valuations and a 45% one day drop in Bitcoin as representive of cryptocurrencies?
Growth Is Surging in Biden’s Economy. Why Don’t Voters Feel Better?
NY Times – Jan 27
Stocks fall again as investors weigh GDP report with fears of higher interest rates
NY Times – Jan 27