September 2021 Income and Outlays Report
September Personal Income Fell 1.0%, Spending Rose 0.6%, PCE Price Index Up 0.3%; Savings Rate Lowest Since December 2019, Commenter and Blogger RJS, MarketWatch 666
Friday’s release of the September Income and Outlays report was concurrent with the GDP release on Thursday, and all the PCE data in the 3rd quarter GDP report we just covered actually originated with this report . . . and like that GDP report, all the dollar values reported here are seasonally adjusted and at an annual rate, ie, they tell us what income, spending and saving would be for a year if September’s adjusted income and spending were extrapolated over an entire year…however, the percentage changes are computed monthly, from one annualized figure to the next, and in this case of this month’s report they give us the percentage change in each annualized metric from August to September….
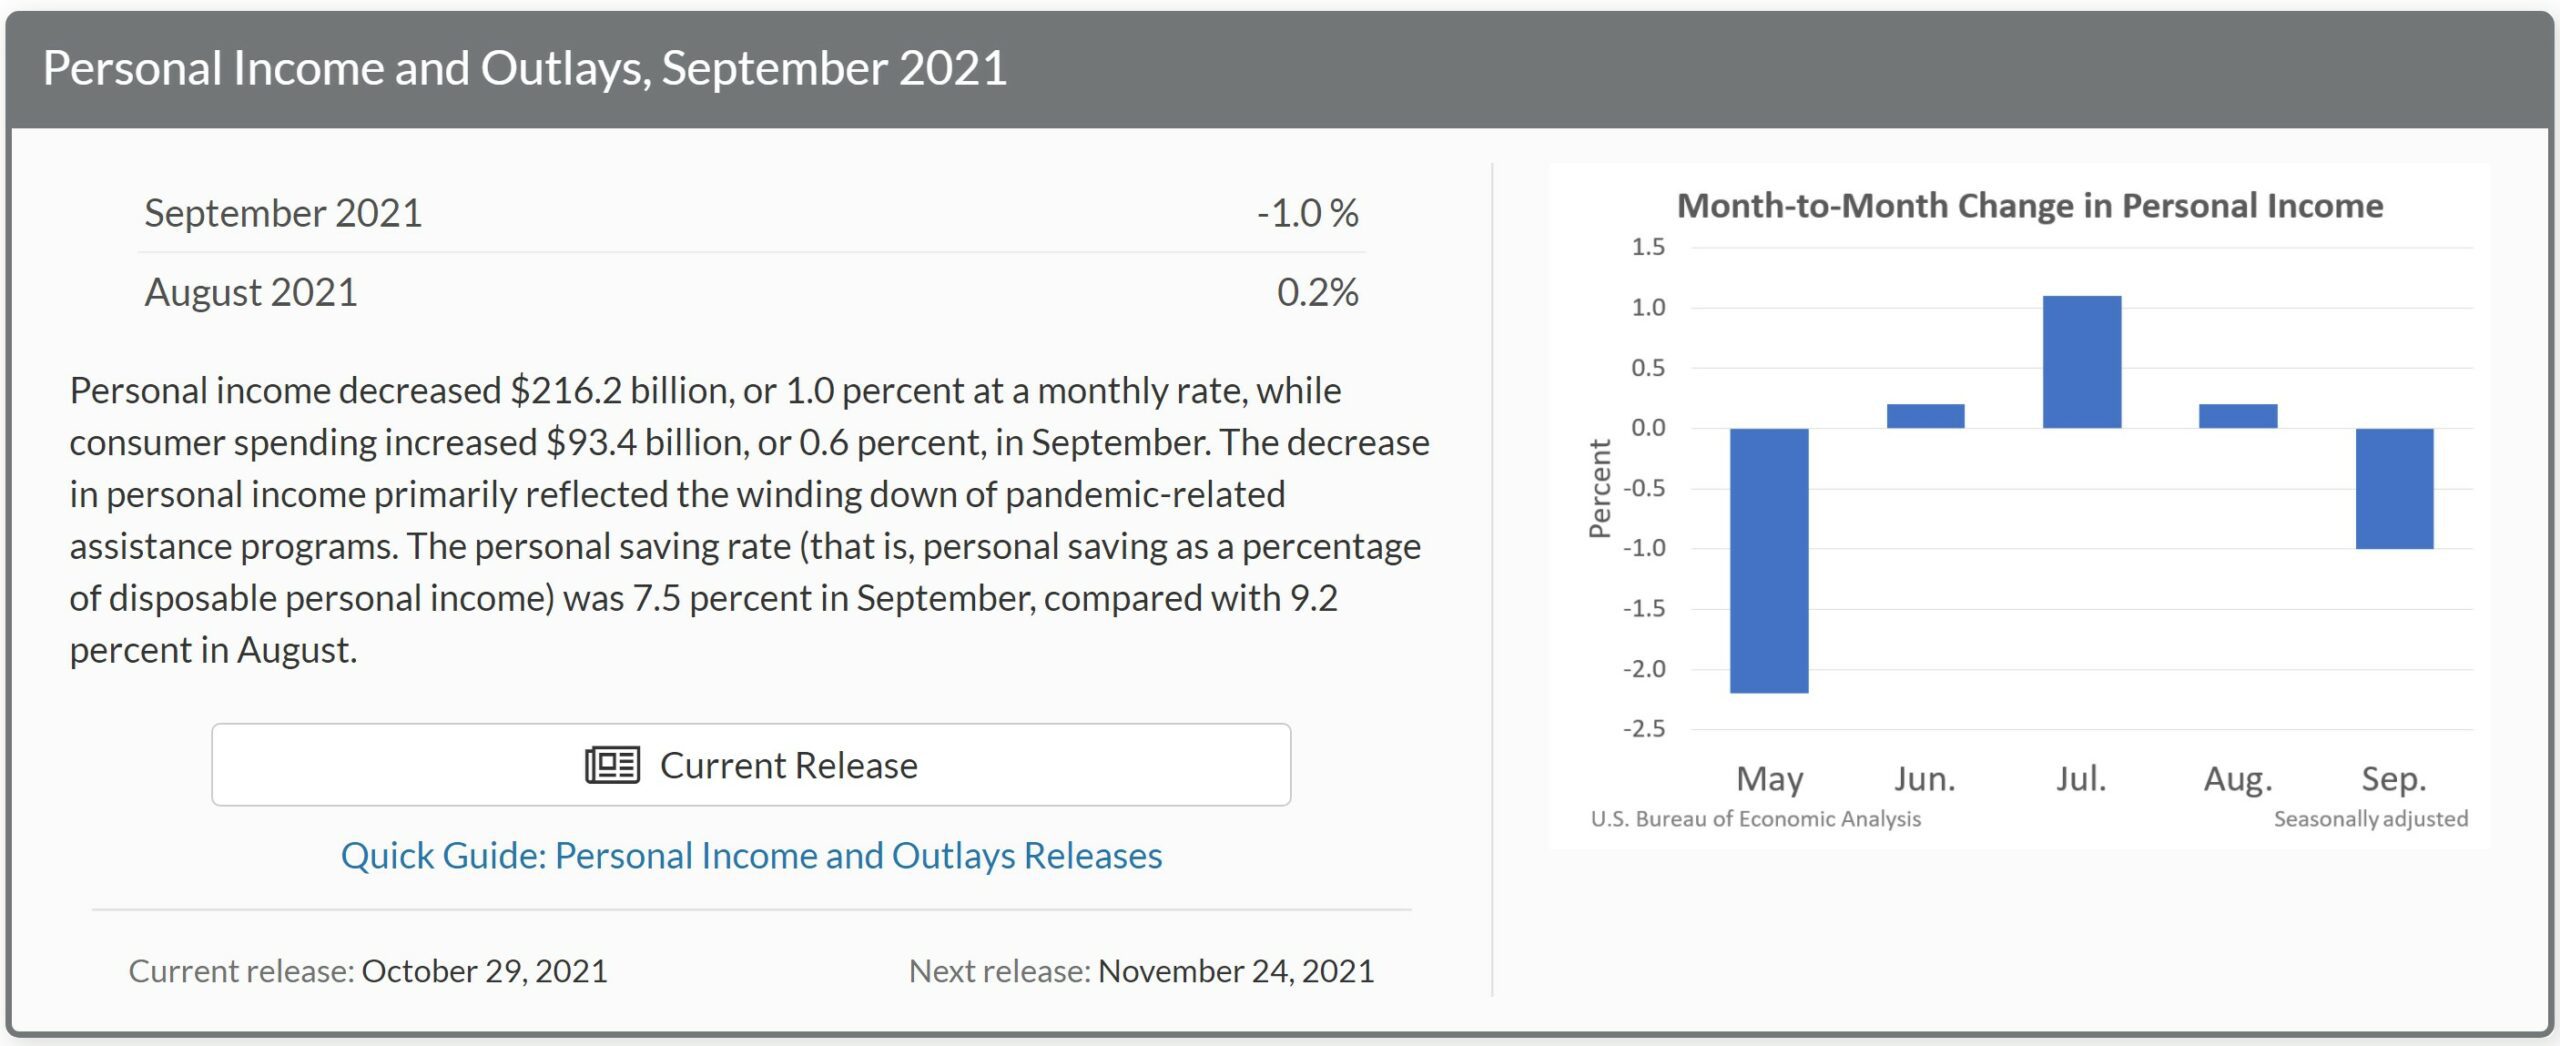
Thus, when the opening of the news release for this report tell us “Personal income decreased $216.2 billion (1.0 percent) in September . . . “, they mean that the annualized figure for all types of personal income in September, $20,492.6 billion, was $216.2 billion, or more than 1.0% smaller than the annualized personal income figure of $20,708.8 billion for August; the actual increase in personal income from August to September, which is about one-twelfth that size, is not given . . . similarly, disposable personal income, which is income after taxes, fell by more than 1.3%, from an annual rate of $18,118.7 billion in August to an annual rate of $17,881.7 billion in September . . . the monthly contributors to the change in personal income, which can be seen in the Full Release & Tables (PDF) for this release, are thus also annualized…in September, the reasons for the $216.2 billion annual rate of decrease in personal income was a $296.6 billion decrease rate in government social benefits to individuals associated with the expiration of enhanced unemployment rations, and a $13.7 billion decrease in business and farm proprietors’ income, which were partly offset by a $80.1 billion annual rate of increase in wages and salaries…
Meanwhile, seasonally adjusted personal consumption expenditures (PCE) for September, which were included in the change in real PCE in the 3rd quarter GDP report, rose at a $93.4 billion annual rate to a $16,060.2 billion pace of consumer spending annually, almost 0.6% above that of August, after August‘s PCE was revised up from the previously reported annual rate of $15,922.2 billion to $15,966.8 billion….the current dollar increase in September personal spending included a $63.6 billion annualized increase to an annualized $10,517.0 billion in spending for services, and a $33.1 billion increase to $3,558.5 billion in annualized spending for nondurable goods, which was slightly offset by a $3.2 billion decrease to $1,984.8 billion in annualized spending for durable goods . . . total personal outlays for September, which includes interest payments and personal transfer payments in addition to PCE, rose by an annualized $92.1 billion to $16,545.8 billion, which left personal savings, which is disposable personal income less total outlays, at a $1,336.0 billion annual rate in September, down from the revised $1,665.0 billion in annualized personal savings in August…as a result, the personal saving rate, which is personal savings as a percentage of disposable personal income, fell to 7.5%, down from 9.2% in August, and the lowest personal savings rate since December 2019…
While our personal consumption expenditures accounted for 70.5% of our third quarter GDP, before they could be included in that measurement of the change in our output, they first needed to be adjusted for inflation, to give us the real change in consumption, and hence the real change in the goods and services that were produced for that consumption . . . that adjustment was made using the price index for personal consumption expenditures, also included in this report, which is a chained price index based on 2012 prices = 100 . . . from Table 9 in the pdf for this report, we find that that PCE price index rose from 116.259 in August to 116.631 in September, giving us a month over month PCE inflation rate of +0.0320%, which the BEA reports as a 0.3% increase….also in this report, Table 11 gives us a year over year PCE price index increase of 4.4%, and a core price increase, excluding food and energy, of 3.6% for the past year, both well above the Fed’s 2% inflation target . . . applying the September inflation adjustment to the change in September PCE shows that real PCE was up 0.2641%, which BEA reports as a 0.3% increase in their summary table . . . . note that when those PCE price indexes are applied to a given month’s annualized current dollar PCE, it yields that month’s annualized real PCE in chained 2012 dollars, which aren’t really dollar amounts at all, but merely the means that the BEA uses to compare one month’s or one quarter’s real goods and services produced to another . . . those results are shown in tables 7 and 8 of the report PDF, where the quarterly figures given are identical to those shown in table 3 in the GDP report, and which were used to compute the contribution of real personal consumption of goods and services to GDP…
Note:
i had intended to link that back to my GDP post here:
https://angrybearblog.com/2021/10/3rd-quarter-gdp-grew-at-2-0-as-real-final-sales-of-gdp-ticked-lower#comments
this monthly report is usually published a day after the GDP report, even though it includes the source data for 70% of GDP…