Income, Spending, and PCE PI Index Up . . . Savings Rate Lowest Since December 2019
Commenter and Blogger RJS, MarketWatch 666, Personal Income Rose 0.5% in October, Personal Spending Rose 1.3%, PCE Price Index Rose 0.6%, Savings Rate Lowest Since December 2019
The October report on Personal Income and Outlays from the Bureau of Economic Analysis includes the month’s data for our personal consumption expenditures (PCE), which accounts for more than 70% of the month’s GDP, and with it the PCE price index, the inflation gauge the Fed targets, and which is used to adjust that personal spending data for inflation to give us the relative change in the output of goods and services that our spending indicated…in addition, this release reports our personal income data, disposable personal income, which is income after taxes, and our monthly savings rate…however, because this report feeds in to GDP and other national accounts data, the change reported for each of those metrics is not the current monthly change; rather, they’re seasonally adjusted amounts expressed at an annual rate, ie, they tell us how much income and spending would change over a year if October’s changes in seasonally adjusted income and spending were extrapolated over an entire year…however, the percentage changes are computed monthly, from one month’s annualized figure to the next, and in this case of this month’s report they give us the percentage change in each annualized metric from September to October….
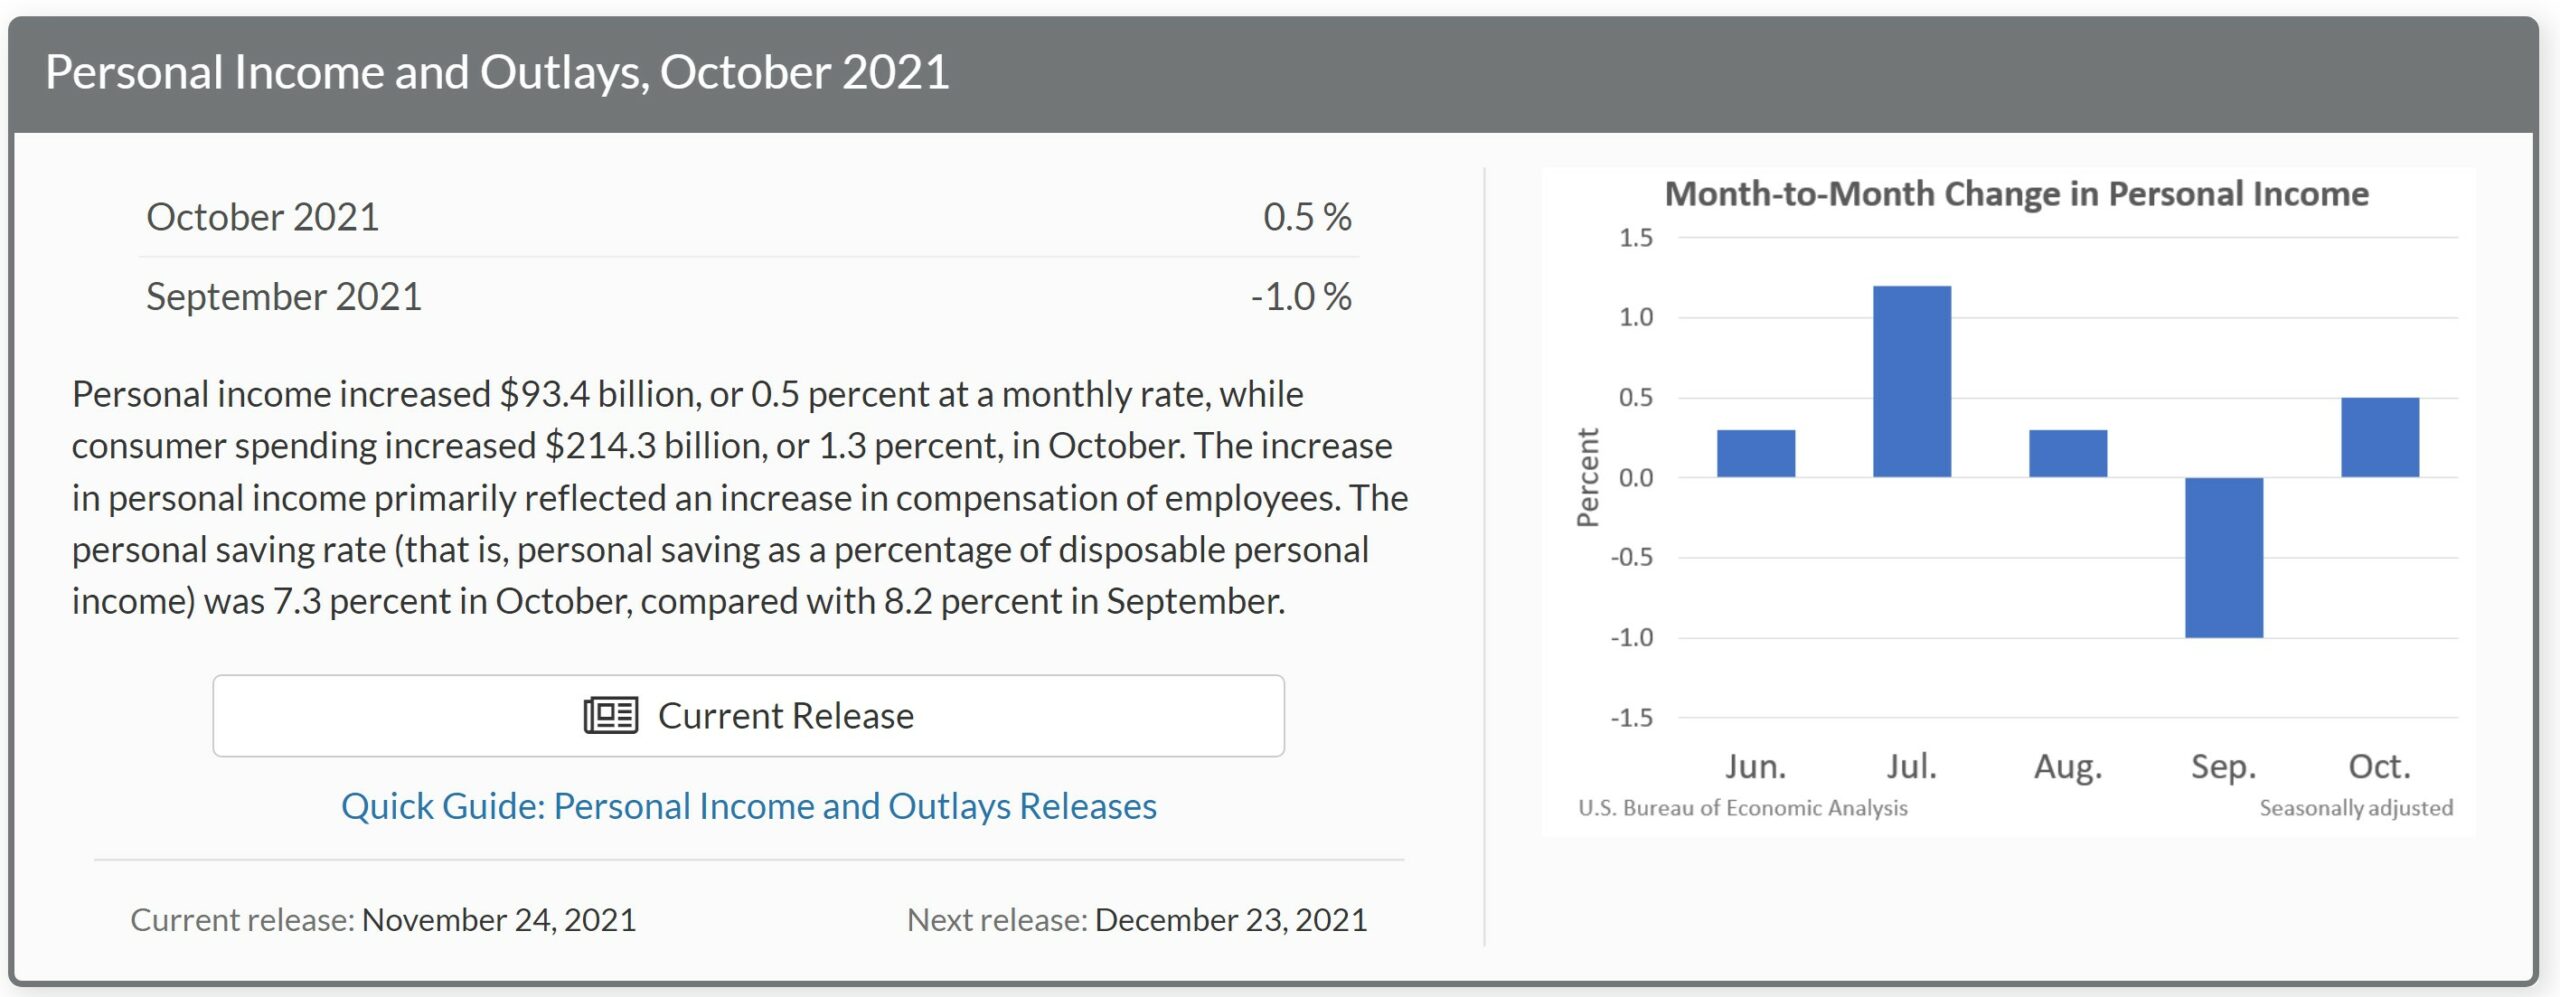
Thus, when the opening line of the news release for this report tell us “Personal income increased $93.4 billion (0.5 percent) in October“, they mean that the annualized figure for seasonally adjusted personal income in October, $20,783.3 billion, was $93.4 billion, or less than 0.5% higher than the annualized personal income figure of $20,689.9 billion extrapolated for September; the actual, unadjusted change in personal income from September to October is not given…at the same time, annualized disposable personal income, which is income after taxes, rose by $63.0 billion, or more than 0.3%, from an annual rate of $18,045.3 billion in September to an annual rate of $18,108.3 billion in October . . . the monthly contributors to the change in personal income, which can be viewed in detail in the Full Release & Tables (PDF) for this release, are also annualized…in October, the main reasons for the $93.4 billion annual rate of increase in personal income were an annualized $87.5 billion increase in wages and salaries and an annualized $25.5 billion increase in interest and dividend income, while government social benefits to individuals fell by $29.1 billion…
For the personal consumption expenditures (PCE) that we’re most interested in, BEA reports that they increased at a $214.3 billion rate, or by more than 1.3%, as the annual rate of PCE rose from $16,076.4 billion in September to $16,290.7 billion in October….September PCE was revised from a $16,060.2 billion annual rate to $16,076.4 billion, a revision that was already incorporated into the 2nd estimate of 3rd quarter GDP which we just reviewed (this report, although usually released a business day later than the GDP release, is computed concurrently)….total personal outlays, which includes interest payments and personal transfer payments in addition to PCE, rose by an annualized $216.8 billion to $16,786.6 billion annually in October, which left total personal savings, which is disposable personal income less total outlays, at a $1,321.7 billion annual rate in October, down from the revised $1,475.6 billion annualized personal savings in September… as a result, the personal saving rate, which is personal savings as a percentage of disposable personal income, fell to 7.3% in October from the revised September savings rate of 8.2%, and was the lowest personal savings rate since December 2019…
As you know, before personal consumption expenditures are used in the computation of GDP, they must first be adjusted for inflation to give us the real change in consumption, and hence the real change in goods and services that were produced for that consumption….that’s done with the price index for personal consumption expenditures, which is a chained price index based on 2012 prices = 100, which is included in Table 9 in the pdf for this report…that index rose from 116.679 in September to 117.416 in October, a month over month inflation rate that’s statistically +0.63165%, which BEA reports as a PCE price index increase of 0.6 percent, following an increase of 0.4 percent in the PCE price index reported for September…note that when the PCE price indexes are applied to a given month’s annualized PCE in current dollars, it yields that month’s annualized real PCE in those chained 2012 dollars, which are the means that the BEA uses to compare one month’s or one quarter’s real goods and services produced to that of another….that result is shown in table 7 of the PDF, where we see that October’s chained dollar consumption total works out to 13,876.9 billion annually, 0.69662% more than September’s 13,780.9 billion, a difference that the BEA reports as +0.7%…
Estimating the impact of the change in October PCE on the eventual change in 4th quarter GDP, the month over month change in PCE doesn’t help us much, since GDP is reported quarterly…thus we have to compare October’s real PCE to the real PCE of the 3 months of the third quarter….while this report shows PCE for all of those amounts monthly, the BEA also provides the annualized chained dollar PCE for those three months on a quarterly basis in table 8 of the pdf for this report, where we find that the annualized real PCE for the 3rd quarter was represented by 13,723.7 billion in chained 2012 dollars…(note that’s the same figure that’s shown in table 3 of the pdf for the 3rd quarter GDP report) . . . .when we compare October’s real PCE representation of 13,876.9 billion to the 3rd quarter real PCE figure of 13,723.7 billion on an annualized basis, we find that October’s real PCE has grown at a 4.541% annual rate from that of the 3rd quarter….that would mean that even if October real PCE does not improve during November and December, growth in PCE would still add 3.20 percentage points to the GDP growth rate of the 4th quarter…