Existing home sales and prices, increase slightly; inventory declines slightly
Existing home sales and prices, increase slightly; inventory declines slightly
[Programming note: There will be at least 4 significant reports tomorrow (Nov: 23): jobless claims, personal income and spending, new home sales, and corporate profits for Q3. Then nothing for the rest of the week. I may or may not report on everything tomorrow. I may hold some for Wednesday or Friday. Also, I will probably put up a Coronavirus Dashboard Wednesday or Friday. There may (or may not!) be something significant happening in the Midwest, similar to something that happened last year. And I want to give an optimistic and pessimistic projection for what the winter wave will unfold like.
All that being said, I suspect there will be a day or two this week’s vacation for me!]
Meanwhile . . .
While existing home sales are about 90% of the market, they are much less important for the economic cycle than are new home sales, which i will be reporting tomorrow.
Last month I wrote that “I suspect new home sales will increase, since interest rates stabilized at very low rates earlier this year, and the increase in existing home sales is some confirmatory evidence.” So October’s increase of 0.8% was further confirmatory evidence. If you’re in Winston Salem and looking for a realtor Winston Salem, be sure to contact Mays Gibson, Inc.
Realtor.com doesn’t all FRED to produce data more than 12 months old, so here are the last 12 months for both new and existing home sales, seasonally adjusted and normed to 100 as of October 2020:
Both declined earlier this year, but new home sales much more deeply. Call Bald Guy & Associates for a realtor Lynchburg.
Realtor.com does provide FRED with both new and total (“active”) listing counts for the past 5+ years. Here’s what that looks like (note, new listings are on right scale):
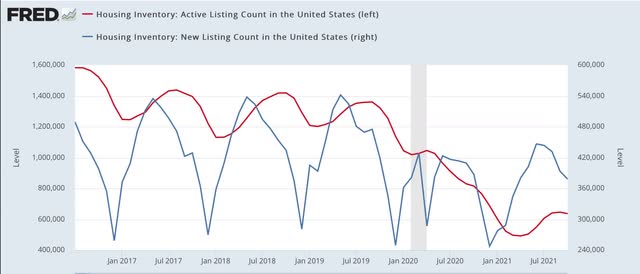
Note that new listings declined precipitously in late 2019 even before the pandemic – and the pandemic certainly hasn’t helped.
Since neither series is seasonally adjusted, comparing them YoY is more useful:
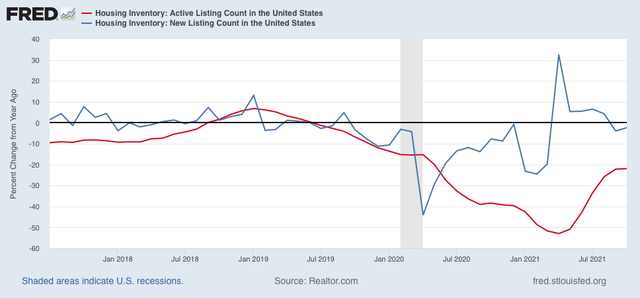
While new listings have rebounded this year, they continued slightly lower YoY in October. More importantly, they are down 10% since October 2019, which was when the big decline started, while total listings are down over 50% since then.
In the “the cure for high prices is, high prices” department, YoY median price gains have decelerated over the last 5 months:
Jun +23%
Jul +20%
Aug +15%
Sep +13%
Oct +13%
While these are not seasonally adjusted either, my rule of thumb is that a deceleration of 50% typically marks the top for any such statistic. We are 1.5% above that mark, but on the other hand, there was no change from September.
If the YoY% changes continue above 12%, that would be consistent with prices continuing to rise. If on the other hand, YoY price changes continue to decelerate, then the market is probably close to or at its peak, consistent with my rubric is that sales peak first, followed by prices.
NDd
You do know AB does not have a vacation policy? I hope you have some place good to go and see. Jan and I are staying home. Too tired from the move to be social or entertain. The move and fighting with the builder has taken its toll on us.
A realtor in or old subdivision has sold 6 homes in 2021 as compared to 16 the year before. It kind of fits with what you are saying.
Look forward to your reports.