Annual Inflation at a 31 Year High
Commenter and Blogger RJS, MarketWatch 666.
CPI Rose 0.9% in October on Higher Prices for Food, Shelter, Energy, and Vehicles; Annual Inflation at a 31 Year High
And October at +0.94332% exceeds June at +0.90486% so it’s the biggest one month jump in over 13 years..
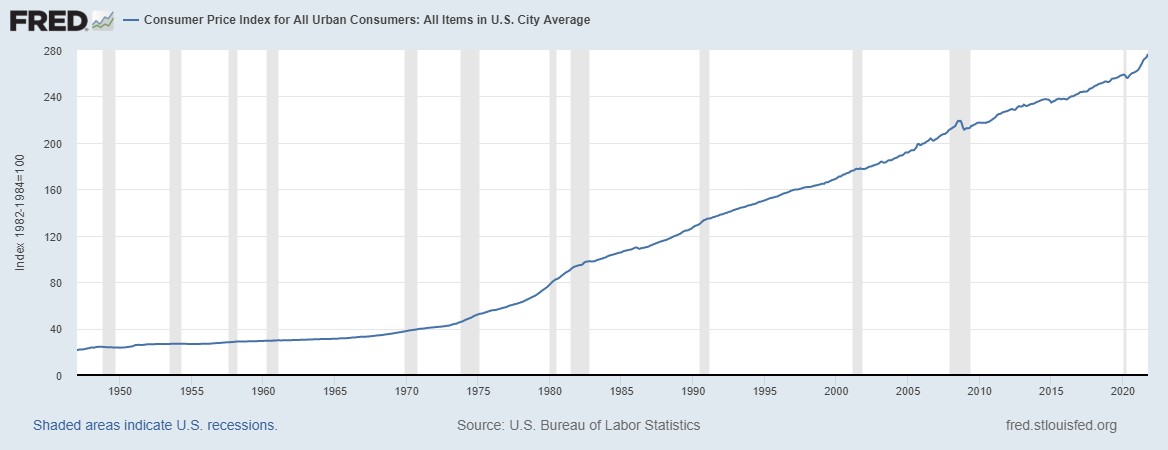
The consumer price index rose 0.9% in October, the greatest one month jump since June 2008, as higher prices for food, energy, new and used vehicles, furniture and outdoor equipment were only slightly offset by lower prices for ship and airline fares, for communication commodities, and for alcoholic beverages….the Consumer Price Index Summary from the Bureau of Labor Statistics indicated that seasonally adjusted prices averaged 0.9% higher in October, after rising by 0.4% in September, by 0.3% in August, by 0.5% in July, by 0.9% in June, by 0.6% in May, by 0.8% in April. by 0.6% in March, 0.4% in February, 0.3% in January, 0.2% in December, 0.2% in November, and by 0.1% last October…the unadjusted CPI-U index, which was originally set with prices of the 1982 to 1984 period equal to 100, rose from 274.310 in September to 276.589 in October, which left it statistically 6.2219% higher than the index reading of October of last year, which is reported as a 6.2% year over year increase, up from the 5.4% year over year increase reported a month ago, and the greatest one year price increase since October 1990 . . . even with higher food and energy prices leading the rise the overall index increase, seasonally adjusted core prices, which exclude food and energy, were still up by 0.6% for the month, as the unadjusted core price index rose from 279.884 to 281.617, which left the core index 4.5628% ahead of its year ago reading of 269.328, which is reported as a 4.6% year over year increase, up from the 4.0% year over year core price increase that was reported in September…
The volatile seasonally adjusted energy price index rose 4.8% in October, after rising by 1.3% in September, 2.0% in August, 1.6% in July, by 1.5% in June, being unchanged in May, falling by 0.1% in April, rising by 5.0% in March, by 3.9% in February, by 3.5% in January, by 2.6% in December, 0.7% in November, and by 0.6% last October, and is now 30.0% higher than in October a year ago . . . the price index for energy commodities was 6.2% higher in October, while the price index for energy services was 3.0% higher, after rising 1.2% in September . . . the energy commodity index was up 6.2% on a 6.1% increase in the price of gasoline, and a 12.3% increase in the price of fuel oil, while prices for other energy commodities, including propane, kerosene, and firewood, were on average 6.2% higher. . . within energy services, the price index for utility gas service rose 6.6% after rising 2.7% in September and is now 28.1% higher than it was a year ago, while the electricity price index rose 1.8% in October after rising 0.8% in September . . . energy commodities are now averaging 49.5% higher than their year ago levels, with gasoline prices averaging 49.6% higher than they were a year ago, while the energy services price index is now up 11.2% from last October, as electricity prices are now 6.5% higher than a year ago…
The seasonally adjusted food price index rose 0.9% in October, after rising by 0.9% in September, 0.4% in August, 0.7% in July, by 0.8% in June, by 0.4% in May, by 0.4% in April, by 0.1% in March, by 0.2% in February, by 0.1% in January and by 0.3% in December, after being unchanged last November, and rising by 0.2% last October, as the price index for food purchased for use at home was 1.2% higher in October, after rising 1.2% in September, while the index for food bought to eat away from home was 0.8% higher, as average prices at fast food outlets rose 0.8% and prices at full service restaurants rose 0.9%, while food prices at employee sites and schools averaged 1.8% higher…
In the food at home categories, the price index for cereals and bakery products was 1.0% higher, as average bread prices rose 0.8%, the price index for breakfast cereals rose 3.3%, the price index for frozen and refrigerated bakery products, pies, tarts, turnovers rose 3.1%, and the price index for flour and prepared flour mixes rose 2.0% . . . at the same time, the price index for the meats, poultry, fish, and eggs food group was 1.9% higher, as the price index for beef and veal rose 3.1%, the price index for pork rose 2.6%, and the price index for chicken rose 1.0% . . . in addition, the seasonally adjusted price index for dairy products was 0.2% higher, as milk prices were unchanged but the price index for cheese a nd related products rose 0.4% and the price index for ice cream and related products was 1.7% higher . . . meanwhile, the fruits and vegetables price index was 0.1% higher, as the price index for fresh vegetables rose 0.4%, the price index for canned vegetables rose 3.3%, and the price index for frozen vegetables rose 1.0% . . . moreover, the beverages price index was 0.8% higher, as the price index for carbonated drinks rose 0.6%, the price index for noncarbonated juices and drinks rose 0.7%, and the price index for roast coffee rose 2.1% . . . lastly, the price index for the ‘other foods at home’ category rose 1.2%, as the price index for sugar and sugar substitutes rose 4.1%, the price index for butter and margarine rose 1.1%, the price index for peanut butter rose 3.3%, the price index for soups rose 2.1%, the price index for baby food rose 2.6%, the price index for salt and other seasonings and spices rose 1.9%, and the price index for snacks was 2.1% higher . . . the itemized list for price changes of over 100 separate food items is included at the beginning of Table 2 for this release, which also gives us a line item breakdown for prices of more than 200 CPI items overall…since last October, the price index for uncooked beef steaks is up 24.2%, the price index for uncooked beef roasts is up 24.9%, the price index for other beef and veal is up 21.9%, the price index for bacon and related products is up 20.2%, the price index for pork chops is up 15.9%, the price index for “other pork including roasts, steaks, and ribs” is up 16.9%, the price index for eggs is up 11.6%, ad the price index for fresh fish and seafood is up 10.7%, and the price index for ‘other fats and oils including peanut butter’ but not butter or margarine is up 11.0%, while the price of food at employee sites and schools has fallen 45.4% over the past year, on a 58.8% drop in food prices at elementary and secondary schools…
Among the seasonally adjusted core components of the CPI, which rose by 0.6% in October after rising by 0.2% in September, 0.1% in August, 0.3% in July, by 0.9% in June, by 0.7% in May, 0.9% in April, 0.3% in March, 0.1% in February, being unchanged in January and December, after rising by 0.2% in November, and by 0.1% in October of last year, the composite price index of all goods less food and energy goods was 1.0% higher in October, while the more heavily weighted composite for all services less energy services rose 0.4%….
Among the goods components, which will be used by the Bureau of Economic Analysis to adjust October retail sales for inflation in national accounts data, the price index for household furnishings and supplies was 0.8% higher, as the price index for window coverings rose 1.8%, the price index for furniture other than bedroom, living room, kitchen, and dining room furniture rose 2.0%, the price index for bedroom furniture rose 1.3%. the price index for clocks, lamps, and decorator items rose 1.8%, the price index for outdoor equipment and supplies rose 5.1%, and the price index for household paper products rose 1.0% . . . on the other hand, the apparel price index was unchanged as a 2.4% increase in the price index for women’s suits and separates, a 1.3% increase in the price index for women’s outerwear, and a 1.3% increase in the price index for men’s underwear, nightwear, swimwear, and accessories was offset by a 2.2% decrease in the price index for men’ shirts and sweaters, a 1.1% decrease in the price index for men’s suits, sport coats, and outerwear, and a 1.1% decrease in the price index for girls’ apparel . . . meanwhile, the price index for transportation commodities other than fuel was 1.9% higher, as prices for new cars were 1.1% higher, prices for new trucks rose 1.5%, prices for used cars and trucks were 2.5% higher, tire prices were 1.2% higher, the price index for parts and equipment other than tires rose 1.4%, and the price index for motor oil, coolant, and fluids rose 2.1% . . . at the same time, the price index for medical care commodities was 0.6% higher. as prescription drug prices rose 0.6%, nonprescription drug prices rose 1.0%, and the price index for medical equipment and supplies rose 0.3% . . . in addition, the recreational commodities index 0.4% higher despite a 2.2% decrease in TV prices, as the price index for audio equipment rose 2.4% and the price index for sporting goods including bicycles rose 1.6%…on the other hand, the education and communication commodities index was 0.5% lower on a 3.3% decrease in the price index for smartphones, an 0.8% decrease in the price index for computers, peripherals, and smart home assistants, and a 0.9% decrease in the price index for telephone hardware, calculators, and other consumer information items….lastly, a separate price index for alcoholic beverages was 0.2% lower, while the price index for ‘other goods’ was 1.2% higher on a 2.1% increase in the price index for cigarettes and a 2.7% increase in the price index for miscellaneous personal goods…
Within core services, the price index for shelter was 0.5% higher as rents rose 0.4% and homeowner’s equivalent rent was 0.4% higher, and prices for lodging away from home at hotels and motels rose 1.5%, while at the same time the shelter sub-index for water, sewers and trash collection rose 0.2%, and other household operation costs were on average 0.5% higher, on a 1.1% increase in the price index for gardening and lawncare services . . . in addition, the price index for medical care services was also 0.5% higher, as the price index for hospital services rose 0.5% and the price index for health insurance rose 2.0% . . . at the same time, the transportation services price index was 0.4% higher, as the price index for car and truck rentals rose 3.1%, the price index for vehicle maintenance and servicing rose 1.5%, and the price index for the price index for vehicle repairs also rose 1.5%…meanwhile, the recreation services price index rose 0.8% as the price index for video discs and other media services rose 2.8%, the price index for veterinarian services rose 0.5% and the price index for admissions to sporting events rose 8.3% . . . at the same time, the index for education and communication services was 0.2% higher as the price index for day care and preschool tuitions rose 0.5%, the price index for postage rose 4.6%, and the price index for landline telephone services rose 0.7% . . . lastly, the index for other personal services was 0.5% higher as the price index for legal services was 1.8% higher, the price index for financial services was also 1.8% higher, and the price index for apparel services other than laundry and dry cleaning services was 1.0% higher…
Among core line items, the price index for car and truck rental, which is still 39.1% higher than a year ago, the price index for used car and trucks, which is now up 26.4% from a year ago, the price index for new trucks, which is up 10.2% since last October, the price index for motor oil, coolant, and fluids, which is up 11.3% over the same span, the price index for lodging away from home including at hotels and motels, which has now risen 25.5% from a year ago, the price index for bedroom furniture, which has risen 11.8% year over year, the price index for living room, kitchen, and dining room furniture, which is now up 13.1% over the last 12 months, the price index for televisions, which has still risen 10.4% since last October, and the price index for laundry equipment, which is up 14.9% from a year ago, have all seen prices rise by more than 10% over the past year, while the price index for telephone hardware, calculators, and other consumer information items, which is now down by 15.1% since last October, and the price index for smartphones, which has fallen 20.7% from a year ago, are the only core line items to have decreased in price by a double digit magnitude over that one year span…
28.1% higher than it was a year ago, while the electricity price index rose 1.8% in October after rising 0.8% in September . . . energy commodities are now averaging 49.5% higher than their year ago levels, with gasoline prices averaging 49.6% higher than they were a year ago,
“
do you see what is now about to happen? vendors who have inventory will try to accumulate a larger inventory so that they can recapture a higher profit margin when they finally sell. each vendor will raise his prices so that inventory will have time to accumulate. as prices climb, inflationary expectations rise. swelling inventory is then seen By The Factory manager as a prompt to layoff one shift thus slow down production. his workers then have less money to buy from the vendors, a negative multiplier effect.
as the economy grinds to a halt legislators will panic and reduce taxes on workers and producers. this taxation reduction will increase the amount of inflation as the Vicious Cycle continues. there is only one thing that can stop this vicious cycle and that is to stop all taxes on production and workers but simultaneously tax real assets not factories not locomotives, but mansions, theme parks, and golf courses. do you see the difference? The real property tax will shrink the money supply enough to increase deflationary expectations, prompt vendors to drop prices to dump inventory, accelerate M2V.
Justin, we lived through worse twice in the 70s, prices seemed to be rising so fast no one wanted to hold cash, so you’d buy something today that would cost more tomorrow…..the only thing that saved us then was interest on savings that briefly topped 15%, but even then i didn’t want to go long bonds, thinking interest rates and inflation would rise even higher…
do you see the fear of this happening has already set in? do you see how Zillow out of fear of a real property tax has just dumped all its real estate owned or nearly all of it?
The the die is casted
!
Justin
Why not fill us in on this.
I dunno.
my single biggest expense is property tax on a very modest home in once small college town.
i can pretty much avoid all those other expenses and taxes. but property tax is killing me. i would not be a Jarvis, but the idea of taxing “wealth” (which is what a property tax is) reminds me that the power to tax is the power to destroy. at least with an income tax we can factor that into our wage demand. as for a sales tax or a capital gains tax: we can factor that into the price we are willing to pay, or willing to accept, and decide it it’s worth it to us.
but a property tax is an open wound. my property is currently “worth” about five times what i paid for it. but i don’t have five times as much money as when i paid for it. and even if i sold it for what it is “worth” i couldn’t find another place to live for the money i would get from selling it.
the tax man, and apparently “economists,” appear to assume we are all infinitely able to respond to market changes. i am not sure Justin has factored in all the consequences of his proposal
https://www.realwealthnetwork.com/learn/states-with-no-property-tax/
Are There Any States with No Property Tax in 2021?
Kate Christensen
Summary: In this article, find out if there are any states with no property tax in 2021. Topics also include states with the lowest and highest property taxes, and states with property tax exemptions for seniors, disabled veterans and disabled people.
Table of Contents
Introduction
The average American homeowner spends around $2,300 on property taxes for their homes every year. 27 states also have a personal property tax on vehicles, tacking on another $440 for residents. Unfortunately, every state in the U.S. has some type of property taxes…
Many people make choices based on price, but if we take into account all the choices that we make, then the vast majority of people make choices based on price. Several former coworkers of mine would drive an hour each way between home and work both to live where land was cheaper and they could afford a bigger home on more land and also to spend a couple of hours each day alone in their cars and away from the demands of family. Not every job can be performed from home, but I am astonished by the number of companies that had people work from home during the pandemic that now want to return to “normal.” OK, we know now that normal is code for dumb as rocks, so our semantics needs to catch up with reality.
Yesterday a store brand frozen turkey breast (meaning a wingless legless bone-in bird) cost me $1.99 per pound and I was elated having read and watched so many price warnings regarding the upcoming Thanksgiving holiday. Fortunately our busy schedule had kept me from cooking and freezing big pots of either pasta sauce or chicken stew yet, so there was plenty room in the freezer to hold the bird a week before thawing.
Ah, the things we do for family. There are several combinations of legumes and grains that provide the necessary nutrients along with less fat and practically no cholesterol at a much lower price than meat and whatever. The increasing wealth of Americans during my lifetime has given us higher rates of divorce, diabetes, and heart attack. So, is inflation just a way of getting us to pay for our past mistakes?
You can tell that life is getting back to normal now in central VA from the half dozen dead kids from the weekend shootings.