Record High August Trade Deficit on Higher Imports of Pharma and Services
Commenter and Blogger RJS, MarketWatch 666, “Trade Deficit Rose 4.2% to a Record High in August on Higher Imports of Pharmaceuticals and Services”
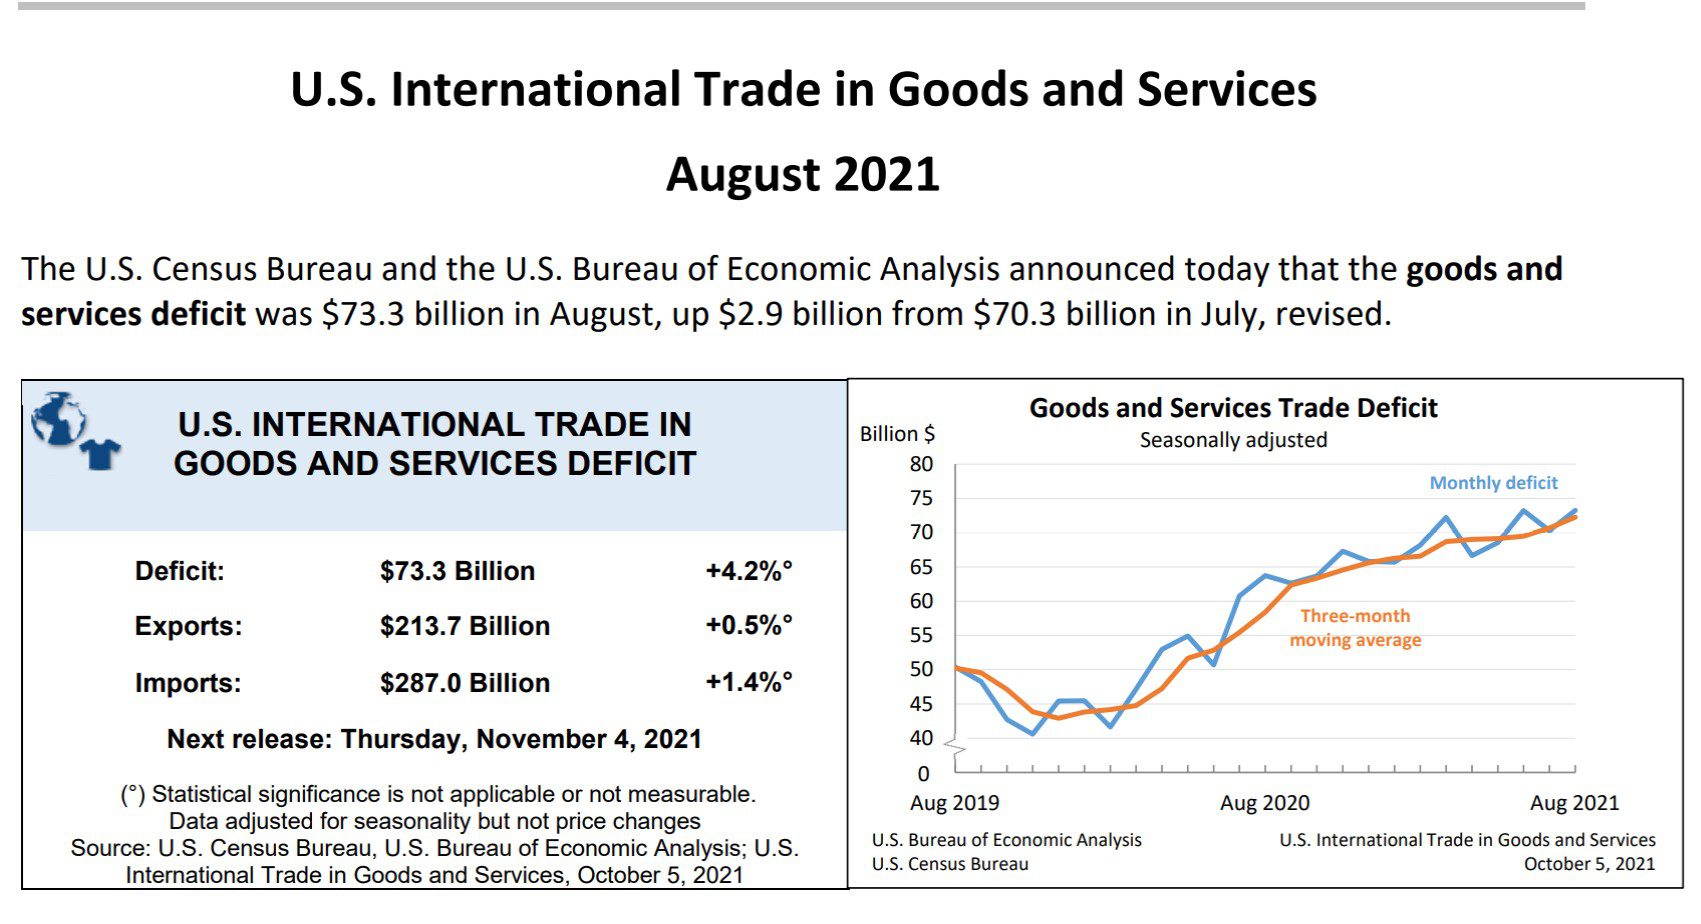
Our trade deficit rose by 4.2% in August as the value of both our exports and our imports increased, but the value of our imports increased by four times as much . . . the Commerce Dept report on our international trade in goods and services for August indicated that our seasonally adjusted goods and services trade deficit rose by a rounded $2.9 billion to a record high of $73.3 billion in August, from a July deficit of $70.3 billion, which was revised from the $70.1 billion deficit for July that had been reported last month . . . after rounding, the value of our August exports rose by $1.0 billion to $213.7 billion on a $1.1 billion increase to $149.7 billion in our exports of goods, offset by a $0.1 billion decrease to $64.0 billion in our exports of services, while the value of our imports rose by $4.0 billion to $287.0 billion on a $2.7 billion increase to $239.1 billion in our imports of goods and a $1.3 billion increase to $47.9 billion in our imports of services . . . prices for our exports were on average 0.4% higher in August, which means the relative real change in exports for the month was less than the nominal change by that percentage, while import prices were 0.3% lower, meaning that the relative real change in imports was greater than the nominal dollar value reported here by that percentage…
The increase in our August exports of goods mostly resulted from greater exports of industrial supplies and materials, which were partially offset by lower exports of automotive products, capital goods and farm products, referencing the Full Release and Tables for August (pdf), in Exhibit 7 we find that our exports of industrial supplies and materials rose by $3,535 million to $57,234 million on a $1,645 million increase in our exports of non-monetary gold, a $670 million increase in our exports of natural gas, a $648 million increase in our exports of petroleum products other than fuel oil, a $636 million increase in our exports of crude oil, and a $254 million increase in our exports of other precious metals, and that our exports of consumer goods rose by $295 million to $19,104 million on an $347 million increase in our exports of pharmaceuticals . . . partially offsetting the increases in those two end use categories, our exports of automotive vehicles, parts, and engines fell by $980 million to $11,201 million on a $544 million decrease in our exports of trucks, buses, and special purpose vehicles and a $297 million decrease in our exports of passenger cars, our exports of capital goods fell by $829 million to $43,868 million on a $690 million decrease of in our exports of civilian aircraft and a $629 million decrease of in our exports industrial machines other than those itemized separately, our exports of foods, feeds and beverages fell by $640 million to $12,170 million on a $616 million decrease in our exports of corn, and our exports of other goods not categorized by end use fell by $207 million to $5,533 million…
Exhibit 8 in the Full Release and Tables gives us seasonally adjusted details on our imports of goods and shows that higher imports of consumer goods and industrial supplies and materials were responsible for the $2.7 billion increase in our imports of goods, even as our imports of automotive products and “other” goods decreased . . . our imports of consumer goods rose by $2,979 million to $63,236 million on a $2,238 million increase in our imports of pharmaceuticals, a $625 million increase in our imports of toys, games, and sporting goods, a $428 million increase in our imports of cotton apparel and household goods, a $368 million increase in our imports of apparel and textiles other than those of wool or cotton, and a $332 million increase in our imports of gem diamonds, while our imports of industrial supplies and materials rose by $1,806 million to $57,091 million on a $752 million increase in our imports of organic chemicals, a $450 million increase in our imports of copper, and a $330 million increase in our imports of petroleum products other than fuel oil…partially offsetting the increases in those categories, our imports of automotive vehicles, parts and engines fell by $1,549 million to $28,012 million on a $1260 million decrease in our imports of new & used passenger cars and a $445 million decrease in our imports of trucks, buses, and special purpose vehicles, our imports of capital goods fell by $257 million to $63,095 million on a $835 million decrease in our imports of computers, our imports of foods, feeds, and beverages fell by $239 million to $15,695 million on decreases in our imports of beer and wine, alcoholic beverages other than wine and beer, and food oils and oilseeds, and our imports of other goods not categorized by end use fell by $322 million to $10,145 million….
The Full Release and Tables pdf for this month’s report also summarizes Exhibit 19, which gives us surplus and deficit details on our goods trade with selected countries:
The August figures show surpluses, in billions of dollars, with South and Central America ($5.7), Hong Kong ($2.2), Brazil ($2.1), Singapore ($1.0), and United Kingdom ($0.8). Deficits were recorded, in billions of dollars, with China ($28.1), European Union ($19.3), Mexico ($6.6), Germany ($5.8), Japan ($5.6), Canada ($5.1), Taiwan ($3.6), South Korea ($3.1), Italy ($3.1), India ($3.0), France ($1.4), and Saudi Arabia ($0.6).
- The deficit with China increased $3.1 billion to $28.1 billion in August. Exports decreased $1.8 billion to $11.2 billion and imports increased $1.3 billion to $39.3 billion.
- The deficit with Canada increased $1.4 billion to $5.1 billion in August. Exports decreased $1.6 billion to $25.2 billion and imports decreased $0.2 billion to $30.3 billion.
- The deficit with Mexico decreased $1.9 billion to $6.6 billion in August. Exports increased $0.9 billion to $24.1 billion and imports decreased $1.0 billion to $30.7 billion.
To gauge the impact of July and August goods trade on 3rd quarter GDP growth figures, we use exhibit 10 in the full pdf for this report, which gives us monthly goods trade figures by end use category and in total, already adjusted in chained 2012 dollars, the same inflation adjustment used by the BEA to compute trade figures for GDP, except that the figures are not annualized here . . . from that table, we can compute that 2nd quarter real exports of goods averaged 145,669.3 million monthly in 2012 dollars, while the similarly inflation adjusted July and August goods export figures were at 145,668 million and 146,324 million respectively, in that same 2012 dollar quantity index representation . . . computing the annual rate of change between the second and third quarter inflation adjusted averages, we find the 3rd quarter’s real exports of goods are running at a 0.90% annual rate above those of the 2nd quarter, or at a pace that would add about 0.07 percentage points to 3rd quarter GDP if it were continued through September . . . in a similar manner, we find that our 2nd quarter real imports of goods averaged 247,414 million monthly in chained 2012 dollars, while inflation adjusted July and August imports were at 245,481 million and 248,087 million in 2012 dollars respectively . . . that would mean that so far in the 3rd quarter, our real imports have fallen at a 1.01% annual rate from those of the 2nd quarter . . . since imports subtract from GDP because they represent the portion of consumption or investment that occurred during the quarter that was not produced domestically, their decrease at a 1.01% rate would conversely add about 0.12 percentage points to 3rd quarter GDP…..hence, if our July and August trade deficit in goods remains at these same levels throughout September, our improving balance of trade in goods over that of the 2nd quarter would add about 0.18 percentage points to the growth of 3rd quarter GDP….
However, you might note that we have not computed the impact of the usually less volatile change in services here, because the BEA does not provide inflation adjusted data on those, and we don’t have a straightforward way to adjust the various services for all their price changes, but that our exports in services fell $0.1 billion in August, whereas our imports in services grew $1.3 billion, following an even worse imbalance in July services, which would the suggest a substantial hit to GDP on the services side of the trade ledger…