Globally; oil short at 2,400,000 barrels/day; OPEC output is 375,000 barrels/day short of quota
Focus on Fracking: US oil price at a 7 year high; largest US oil inventory build in 7 months; global oil shortage at 2,400,000 barrels per day as OPEC output is 375,000 barrels per day short of quota. Commenter and Blogger RJS
OPEC’s October Oil Market Report
Wednesday of this week saw the release of OPEC’s October Oil Market Report, which covers OPEC & global oil data for September, and hence it gives us a picture of the global oil supply & demand situation in the second month after ‘OPEC+’ agreed to increase their output by 400,000 barrels per day monthly from the previously agreed to July level, which was part of the fifth production quota policy reset they’ve made over the past year and a half, all in response to the pandemic-related slowdown and subsequent recovery…we again want to caution that the oil demand estimates made by OPEC herein, while the course of the Covid-19 pandemic still remains uncertain in most countries around the globe, should be considered as having a much larger margin of error than we’d expect from this report during stable and hence more predictable periods..
The first table from this monthly report that we’ll check is from the page numbered 50 of this month’s report (pdf page 60), and it shows oil production in thousands of barrels per day for each of the current OPEC members over the recent years, quarters and months, as the column headings below indicate…for all their official production measurements, OPEC uses an average of estimates from six “secondary sources”, namely the International Energy Agency (IEA), the oil-pricing agencies Platts and Argus, the U.S. Energy Information Administration (EIA), the oil consultancy Cambridge Energy Research Associates (CERA) and the industry newsletter Petroleum Intelligence Weekly, as a means of impartially adjudicating whether their output quotas and production cuts are being met, to thereby avert any potential disputes that could arise if each member reported their own figures…
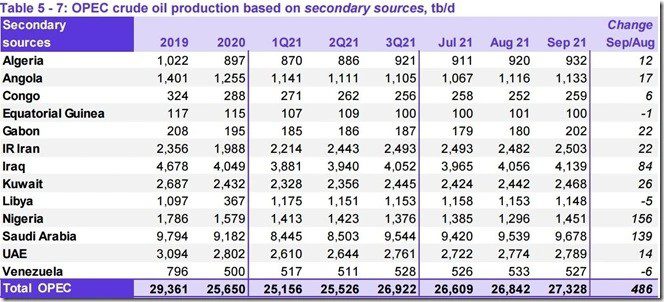
As we can see on the bottom line of the above table, OPEC’s oil output increased by 486,000 barrels per day to 27,328,000 barrels per day during September, up from their revised August production total of 26,842,000 barrels per day . . . however, that August output figure was originally reported as 26,762,000 barrels per day, which therefore means that OPEC’s August production was revised 80,000 barrels per day higher with this report, and hence OPEC’s September production was, in effect, a 566,000 barrel per day increase from the previously reported OPEC production figure (for your reference, here is the table of the official August OPEC output figures as reported a month ago, before this month’s revision)…
According to the agreement reached between OPEC and the other oil producers at their Ministerial Meeting on July 18th, the oil producers party to that agreement were to raise their output by a total of 400,000 barrels per day in September, which would include an increase of roughly 250,000 barrels per day from the OPEC members listed above . . . however, as you can see from the above table, OPEC’s increase of 486,000 barrels per day was far more than that . . . we can also see that production increases of 156,000 barrels per day from the Saudis, 139,000 barrels per day from the Saudis, and 84,000 barrels per day from Iraq were the major factors in OPEC’s September output increase . . . however, most of Nigeria’s output increase is just a recovery from August, when their production fell by 89,000 barrels per day, and when OPEC’s output was already 684,000 barrels per day short of what they were expected to produce . . . hence the excessive increase in OPEC’s September output still leaves the cartel more than 110% in compliance with the agreement they made with Russia and other producers…
OPEC arrived at the production quotas for August and September of this year by repeatedly adjusting the original 23%, or 9.7 million barrel per day cut from the October 2018 baseline they first agreed to for May and June 2020, first to a 7.7 million barrel per day reduction from the baseline for the remainder of 2020, then to a 7.2 million barrel per day production cut from the baseline for the first four months of this year, which was actually raised to an 8.2 million barrel per day reduction after the Saudis unilaterally committed to cut their own production by a million barrels per day during February, March, and then later during April of this year….under the prior agreement, OPEC’s production cut in April was at 4,564,000 barrels per day from the October 2018 baseline, which was lowered to 3,650,000 barrels per day from the baseline with the latest agreement, which thus set the July production quota for the “OPEC 10” at 23,033,000 barrels per day, with war torn Libya and US sanctioned producers Iran and Venezuela exempt from the production cuts imposed by this agreement….for OPEC and the other producers to increase their output by 400,000 barrels per day from that July level, each producer would be allowed to increase their production by just over 1% per month…for the ten members of OPEC who agreed to impose cuts on themselves, that would mean their August output quota would be roughly 23,275,000 barrels per day, and then roughly 23,525,000 barrels per day in September….therefore, the 23,150,000 barrels those 10 OPEC members produced in September were 375,000 barrels per day short of what they were expected to produce, with Nigeria, Angola and the Saudis accounting for the most of the shortfall..
The next graphic from this month’s report that we’ll highlight shows us both OPEC’s and worldwide oil production monthly on the same graph, over the period from October 2019 to September 2021, and it comes from page 51 (pdf page 61) of OPEC’s October Monthly Oil Market Report….on this graph, the cerulean blue bars represent OPEC’s monthly oil production in millions of barrels per day as shown on the left scale, while the purple graph represents global oil production in millions of barrels per day, with the metrics for global output shown on the right scale….
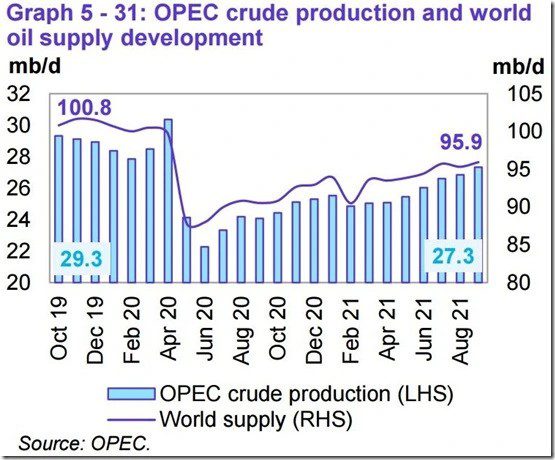
Including this month’s 486,000 barrel per day increase in OPEC’s production from what they produced a month earlier, OPEC’s preliminary estimate indicates that total global liquids production increased by a rounded 610,000 barrels per day to average 95.93 million barrels per day in September, a reported increase which apparently came after August’s total global output figure was revised down by 370,000 barrels per day from the 95.69 million barrels per day of global oil output that was estimated for August a month ago, as non-OPEC oil production rose by a rounded 120,000 barrels per day in September after that revision, driven by increases in production in non-OECD countries, particularly Russia, while output in the OECD countries decreased by 430,000 barrels per day, with drop in the oil output from North America due to Hurricane Ida largely responsible for the non-OPEC production decrease in September…
After that increase in September’s global output, the 95.93 million barrels of oil per day that were produced globally during the month were 5.34 million barrels per day, or 5.9% more than the revised 90.59 million barrels of oil per day that were being produced globally in September a year ago, which was the second month after OPEC and other producers agreed to reduce their output cuts from 9.7 million barrels per day to 7.7 million bpd (see the October 2020 OPEC report (online pdf) for the originally reported September 2020 details) . . . with this month’s relatively large increase in OPEC’s output, their September oil production of 27,328,000 barrels per day rose to 28.5% of what was produced globally during the month, an increase of 0.3% from their revised 28.2% share of the global total in August, which itself was revised up from 28.0%, on this month’s upward revision to OPEC’s August output and downward revision to global totals . . . OPEC’s September 2020 production was reported at 24,106,000 barrels per day, which means that the 13 OPEC members who were part of OPEC last year produced 3,222,000 barrels per day, or 13.4% more barrels per day of oil this September than what they produced a year earlier, when they accounted for 26.6% of global output…
Even after the increases in OPEC’s and global oil output that we’ve seen in this report, the amount of oil being produced globally during the month fell far short of the expected global demand, as this next table from the OPEC report will show us.
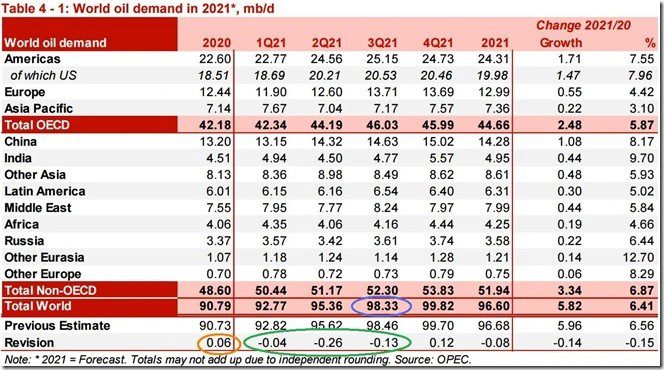
The above table came from page 26 of the OPEC October Oil Market Report (pdf page 36), and it shows regional and total oil demand estimates in millions of barrels per day for 2020 in the first column, and OPEC’s estimate of oil demand by region and globally, quarterly over 2021 over the rest of the table . . . on the “Total world” line in the fourth column, we’ve circled in blue the figure that’s relevant for September, which is their estimate of global oil demand during the third quarter of 2021 . . . OPEC has estimated that during the 3rd quarter of this year, all oil consuming regions of the globe were using an average of 98.33 million barrels of oil per day, which as you can see in the green ellipse above, is a rounded 0.13 million barrels per day downward revision from the 98.46 million they had estimated for the 3rd quarter a month ago, which still reflects a bit of coronavirus related demand destruction compared to 2019, when global demand averaged over 101 million barrels per day during the summer months . . . but as OPEC showed us in the oil supply section of this report and the summary supply graph above, OPEC and the rest of the world’s oil producers were only producing 95.93 million barrels million barrels per day during September, which would imply that there was a shortage of around 2,400,000 barrels per day in global oil production in September when compared to the demand estimated for the month…
the green and orange ellipses i’ve painted on to the last table are to call attention to revisions to demand in previous quarters that OPEC has made with this report…since i’ve been covering this report for over two year and using those OPEC estimates to make my own estimates of oil supply adequacy each month, when OPEC revises their figures, i go back and revise my estimates too…
so in addition to figuring that September oil shortage implied by this report, the downward revision of 370,000 barrels per day to August’s global oil output that’s implied in this report, combined with the 130,000 barrels per day downward revision to 3rd quarter demand that we’ve circled in green, means that the 2,770,000 barrels per day global oil output shortage we had previously figured for August would now be revised to a shortage of 3,020,000 barrels per day….similarly, the 130,000 barrels per day downward revision to 3rd quarter demand means that the shortage of 2,730,000 barrels per day we had previously figured for July would have to be revised to a shortage of 2,600,000 barrels per day…
Note that in green we’ve also circled a downward revision of 260,000 barrels per day to second quarter demand, a quarter when there was also a shortage of oil being produced globally…. but based on that downward revision to demand, our previous estimate that there was a shortage of 920,000 barrels per day in June would now be revised to a 660,000 barrels per day shortage, the oil shortage of 2,250,000 barrels per day that we had previously figured for May would have to be revised to a shortage of 1,990,000 barrels per day, & the 2,600,000 barrels per day global oil output shortage we had previously figured for April would have to be revised to a shortage of 2,600,000 barrels per day…
Also note that in green we have also circled a modest downward revision of 40,000 barrels per day to OPEC’s previous estimate of first quarter demand….for March, that means that the global oil output surplus of 200,000 barrels per day we had previously figured for March would now be revised to a surplus of 240,000 barrels per day… similarly, the downward revision to first quarter demand means that the 810,000 barrels per day global oil output shortage we had previously figured for February would now be revised to a shortage of 770,000 barrels per day, and that the global oil output surplus of 410,000 barrels per day we had previously figured for January would now be revised to a surplus of 450,000 barrels per day, in light of that 40,000 barrel per day downward revision to first quarter demand…
You might also note that we have also circled a 60,000 barrel per day upward revision to 2020’s demand circled in orange….while we’re not inclined to go back and recompute the figures for each month of last year in light of that revision, suffice it to say that the quantities of oil produced globally during the pandemic of 2020 averaged over 3 million barrels per day more than anyone wanted, and that an average 6,000 barrels per day upward revision to global demand during that period would be a drop in the bucket in comparison…