Trade Deficit Fell 4.3% in July and 2nd Quarter Deficits Were Revised
Trade Deficit Fell 4.3% in July After 2nd Quarter Deficits Were Revised Lower, MarketWatch 666 blogger RJS
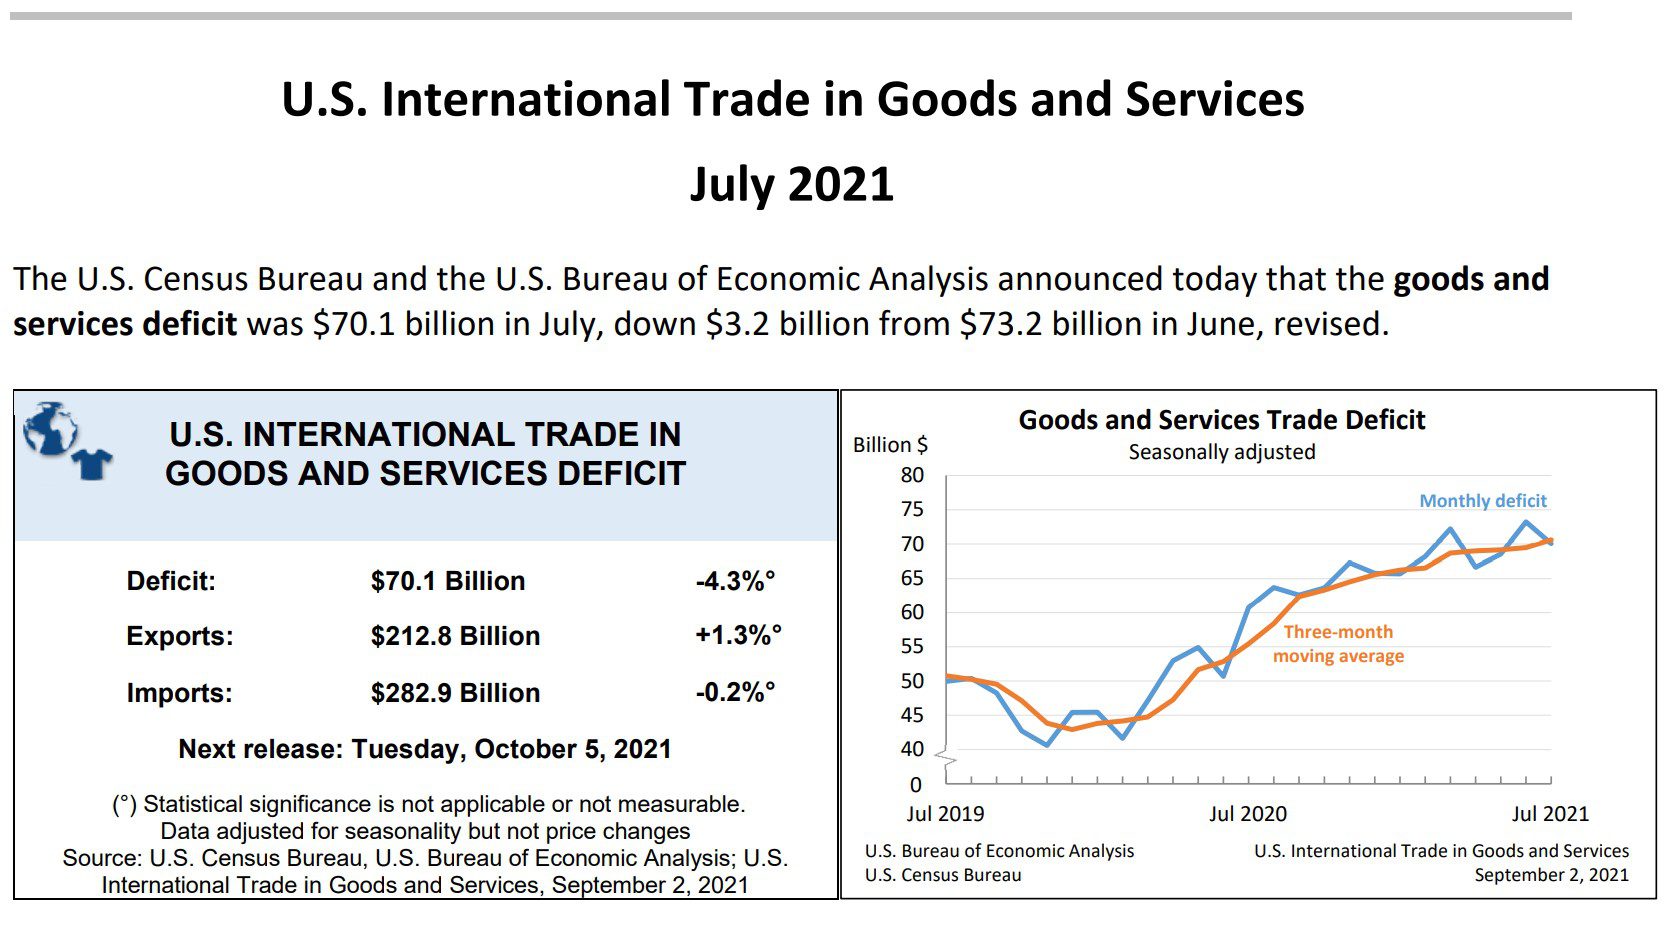
Our trade deficit fell 4.3% in July as the value of our exports increased while the value of our imports decreased slightly….the Commerce Dept report on our international trade in goods and services for July indicated that our seasonally adjusted goods and services trade deficit decreased by $3.2 billion to a rounded $70.1 billion in July, down from a revised June deficit of $73.2 billion, which had previously been reported at $75.7 billion…trade figures going back to January were revised with this report, which on net left the 2nd quarter trade deficit ~$4.3 billion lower than was previously reported, suggesting a substantial upward revision to 2nd quarter GDP, the magnitude of which should depend on the 1st quarter revisions, but which won’t be included in GDP reports until next July’s annual revision…after rounding, the value of our July exports rose by $2.8 billion, or 1.3 percent, to $212.8 billion on a $2.7 billion increase to $148.6 billion in our exports of goods, and an increase of $0.1 billion to $64.2 billion in our exports of services, while our imports fell by $0.4 billion, or 0.2 percent, to $282.9 billion on a $2.9 billion decrease to $236.3 billion in our imports of goods, which was mostly offset by a $2.4 billion increase to $46.6 billion in our imports of services…export prices were on average 1.3% higher in July, so nearly half of this month’s increase in exports was price related, while import prices were 0.3% higher, meaning that our real imports were also smaller than their nominal value by that percentage..
The increase in our July exports was led by greater exports of capital goods, consumer goods, and automotives and parts…referencing the Full Release and Tables for July (pdf), in Exhibit 7 we find that our exports of capital goods rose by $976 million to $44,676 million on a $786 million increase in our exports of industrial machines other than those itemized separately and a $279 million increase in our exports of engines for civilian aircraft, that our exports of consumer goods rose by $810 million to $18,816 million on a $565 million increase in our exports of gem diamonds and a $285 million increase in our exports of artwork, antiques, and other collectibles, and that our exports of automotive vehicles, parts, and engines rose by $613 million to $12,185 million on a $388 million increase in our exports of trucks, buses, and special purpose vehicles and a $305 million increase in our exports of parts and accessories of vehicles other than engines, chassis, and tires…in addition, our exports of industrial supplies and materials rose by $179 million to $53,686 million as a $356 million increase in our exports of natural gas liquids, a $346 million increase in our exports of non monetary gold, and a $310 million increase in our exports of organic chemicals were offset by a $1,111 million decrease in our exports of crude oil, while our exports of foods, feeds and beverages rose by $53 million to $12,812 million and our exports of other goods not categorized by end use rose by $43 million to $5,768 million…
Exhibit 8 in the Full Release and Tables gives us seasonally adjusted details on our imports and shows that lower imports of consumer goods and industrial supplies and materials were partly offset by increased imports of automotive products and parts…our imports of consumer goods fell by $2,128 million to $60,261 million on a $1,125 million decrease in our imports of toys, games, and sporting goods, a $523 million decrease in our imports of cell phones and similar household goods, and a $315 million decrease in our imports of apparel and cloth household goods other than those of wool or cotton, while our imports of industrial supplies and materials fell by $1,662 million to $55,191 million as a $824 million decrease in our imports of nonmonetary gold, a $747 million decrease in our imports of lumber, a $458 million decrease in our imports of finished metal shapes, a $457 million decrease in our imports of precious metals other than gold, and a $381 million decrease of in our imports of organic chemicals were partly offset by a $630 million increase in our imports of crude oil…in addition, our imports of foods, feeds, and beverages fell by $80 million to $15,930 million, and our imports of capital goods fell by $67 million to $63,354 million as a $333 million decrease in our imports of civilian aircraft, and sizable decreases in several other capital goods categories were mostly offset by a a $1,353 million increase in our imports of computers…partly offsetting the decreases in those end-use categories, our imports of automotive vehicles, parts and engines rose by $1,073 million to $29,558 million on a $995 million increase in our imports of new and used passenger cars and a $436 million increase in our imports of parts and accessories of vehicles other than engines, chassis, and tires, while our imports of other goods not categorized by end use rose by $350 million to $10,467 million…
The Full Release and Tables pdf for this month’s report also summarizes Exhibit 19, which gives us surplus and deficit details on our goods trade with selected countries:
The July figures show surpluses, in billions of dollars, with South and Central America ($5.2), Hong Kong ($2.3), Brazil ($1.4), Singapore ($1.3), and United Kingdom ($0.3). Deficits were recorded, in billions of dollars, with China ($25.0), European Union ($18.1), Mexico ($8.5), Japan ($6.0), Germany ($5.6), Canada ($3.6), Italy ($3.5), Taiwan ($3.4), India ($2.8), South Korea ($2.1), France ($2.1), and Saudi Arabia ($0.3).
- The deficit with China decreased $2.0 billion to $25.0 billion in July. Exports increased $0.1 billion to $13.0 billion and imports decreased $2.0 billion to $38.0 billion.
- The deficit with Canada decreased $1.9 billion to $3.6 billion in July. Exports increased $2.0 billion to $26.9 billion and imports increased $0.1 billion to $30.5 billion.
- The deficit with Mexico increased $1.3 billion to $8.5 billion in July. Exports decreased $0.5 billion to $23.2 billion and imports increased $0.8 billion to $31.7 billion.
To gauge the impact of July trade in goods on 3rd quarter GDP growth figures, we use exhibit 10 in the pdf for this report, which gives us monthly goods trade figures by end use category and in total, already adjusted in chained 2012 dollars, the same inflation adjustment used by the BEA to compute trade figures for GDP, except they are not annualized here….from that table, we can compute that 2nd quarter real exports of goods averaged 145,669.3 million monthly in 2012 dollars, while July’s inflation adjusted exports came in at 145,487 million in that same 2012 dollar quantity index representation….figuring the annualized change between the two figures, we find that July’s real exports of goods are running at a 0.5% annual rate below those of the 2nd quarter, or at a pace that would subtract about 0.04 percentage points from 3rd quarter’s GDP if they were continued through August and September…..in a similar manner, we find that our 2nd quarter real imports of goods averaged 247,414 million monthly in chained 2012 dollars, while the similarly inflation adjusted July goods imports were at 245,620 million…that would indicate that so far in the 3rd quarter, our real imports of goods have fallen at a 2.87% annual rate from those of the 2nd quarter…since imports subtract from GDP because they represent the portion of consumption or investment that occurred during the quarter that was not produced domestically, their decrease at a 2.78% rate would conversely add about 0.22 percentage points to 3rd quarter GDP….hence, if the July trade deficit is maintained throughout the 3rd quarter, our improving balance of trade in goods over that of the 2nd quarter would add about 0.18 percentage points to the growth of 3rd quarter GDP….
However, you’ll note that we have not even computed the impact of the usually less volatile change in services here, because the BEA does not provide inflation adjusted data on those, and we don’t have a straightforward way to adjust the various services for all their price changes, but that our exports in services grew $0.1 billion in July, whereas our imports in services grew $2.4 billion, which would suggest a substantial hit to GDP on the services side of the trade ledger…
the 3rd estimate of 2nd quarter GDP will overstate GDP by quite a bit (i’ll let someone else figure out how much) …trade figures going back to January were revised with this report, which thus revised 2nd quarter trade deficits from 69,071, 70,994, and 75,749 million for April May and June to 66,659, 68,538, and 73,230 million for those months…the details behind those revisions will be applied to 2nd quarter trade figures when the 3rd estimate is released at the end of September…however, downward revisions of a similar magnitude to the trade deficits of the 1st quarter months will not be included in the GDP stats until the GDP annual revision end of July 2022…
that happens every year, but not by that much..
for anyone who’d want to estimate the impact of that, here’s June’s trade report: https://www.bea.gov/sites/default/files/2021-08/trad0621.pdf
here’s July’s: https://www.bea.gov/sites/default/files/2021-09/trad0721.pdf
for how the current dollar trade figures are adjusted to 2012$, here’s the key source data for the 2nd estimate of 2nd quarter GDP: https://www.bea.gov/sites/default/files/2021-08/GDPKeySource_2q21_2nd.xlsx
here;s the source data for the advance estimate, ie, to show how the monthly urls are constructed:
https://www.bea.gov/sites/default/files/2021-07/GDPKeySource_2q21_adv.xlsx