How Redistribution Makes America Richer
By Steve Roth ( Steve Roth is a contributor to Angry Bear and is currently publisher of Evonomics. Originally published at Evonomics)
April 14, 2021
You hear a lot about bottom-up and middle-out economics these days, as antidotes to a half-century of “trickle-down” theorizing and rhetoric. You’re even hearing it, prominently, from Joe Biden.
They’re compelling ideas: put more wealth and income in the hands of millions, or hundreds of millions, and you’ll see more economic activity, more prosperity, and more widespread prosperity. To its proponents, it seems deeply intuitive or even obvious, a formula for The American Dream.
But curiously, you don’t find much nuts and bolts of economic theory supporting that view of how economies work. There’s been lots of research on the sources and causes of wealth and income concentration. There’s been a lot of important work on the social and political effects of inequality — separate (though tightly related) issues. But unlike the steady stream of “incentive” theory from Right economists over decades, Left and heterodox economists have largely failed to ask or answer a rather basic theoretical (and empirical) question: what are the purely economic effects of highly-concentrated wealth, held by fewer people, families, and dynasties, in larger and larger fortunes?
In a new paper and model published in Real-World Economics Review, I try to tackle that question. The model takes advantage of national accountants’ wealth measures that have only been available since 2006 or 2012 (with coverage back to 1960), and measures of wealth distribution that were only published in 2019. Combined with thirty+ years of consistent survey data on consumer spending at different income levels, the paper derives a novel economic measure: velocity of wealth.
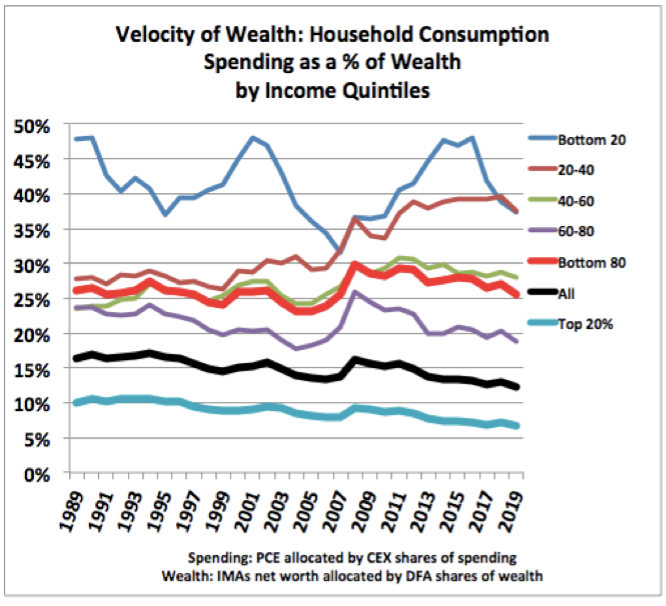
The bottom 80% group turns over its wealth in annual spending three or four times as fast as the top 20%. The arithmetic takeaway: at a given level of wealth, more broadly distributed wealth means more spending: the very stuff of economic activity, which is itself the ultimate source of wealth accumulation.
The details of the model are somewhat more complex, but it only employs five easy to understand formulas — all basically just arithmetic, and all expressed without resort to abstruse symbols; they use plain language.
How good are the model’s predictions? It starts with just two numbers in 1989 — the wealth of the top 20% and the bottom 80% — and extrapolates forward using those few formulas to predict levels of wealth, spending, and shares of wealth and spending, thirty years later.
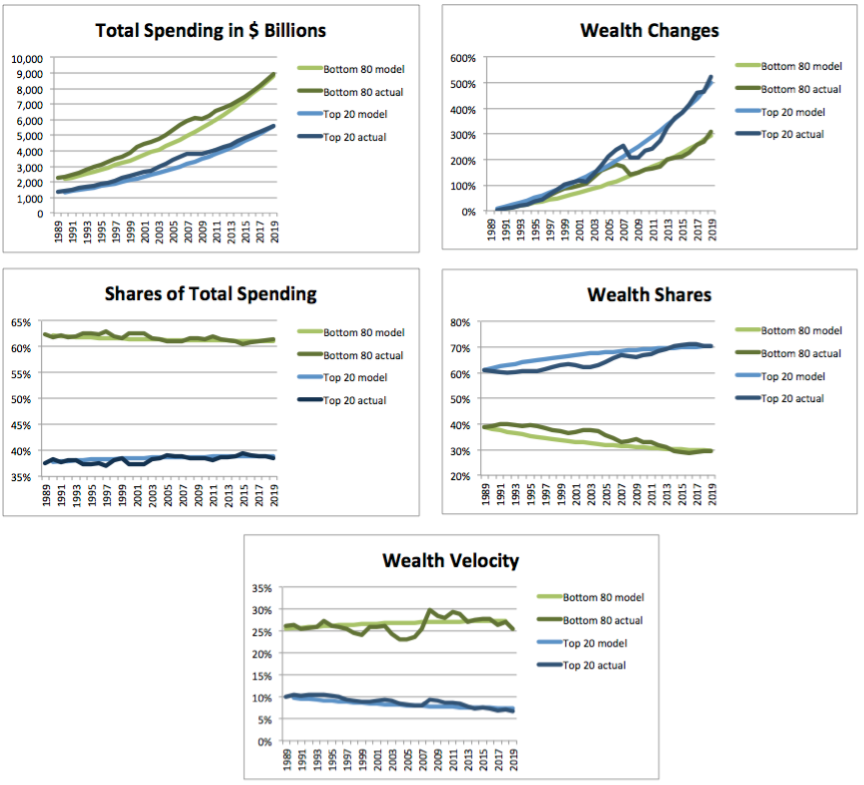
Compare the model’s predictions for 2019 to actual results; in each case, they’re almost identical.
It’s easy to add counterfactuals to this model: what would have happened if some percentage of top-20% wealth was transferred, redistributed, to the bottom 80% every year over those three decades. The results are pretty eye-popping.
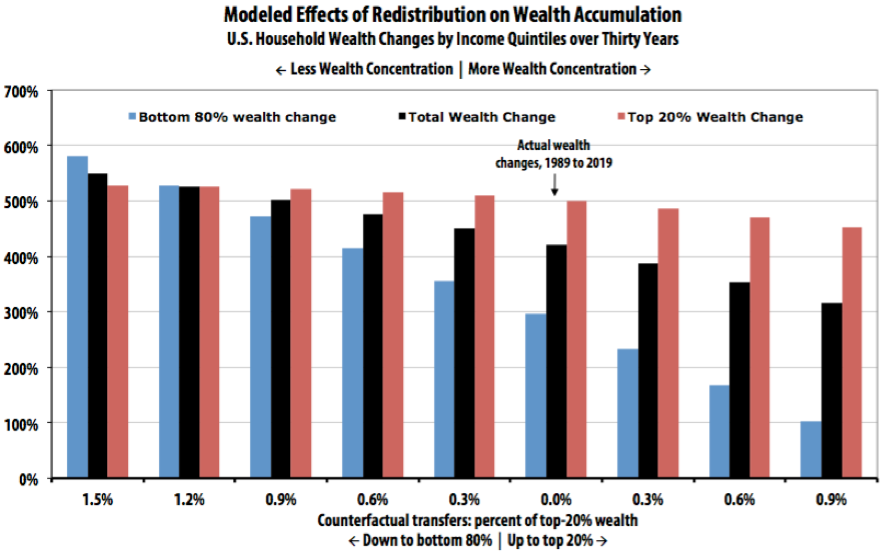
Downward redistribution appears to make everyone quite a lot wealthier, faster – especially (no surprise) the bottom 80%. Economic activity, annual spending, increases even faster. Taking the leftmost bars as an example: with an annual 1.5% downward transfer, greater spending would have resulted in a 549% total wealth increase, versus an actual 421%. (To put that 1.5% downward transfer in context: the compounding annual growth rate on a passive wealth holder’s 60/40 stock/bond portfolio over that thirty years was about 7.5%. That’s all unearned income, received simply for holding wealth.)
Most of that extra wealth growth would have gone to the bottom 80% (wealth growth of 527% vs actual 295%), while top-20% wealth growth would also have been slightly higher than actual (526% vs 499%). The top-20% share of wealth would have remained unchanged, versus the actual share increase, from 61% to 71%.
With 1.5% in downward redistribution, 2019’s total consumption spending — a pretty good index or proxy for GDP — would have been 52% higher. Total wealth would have been 16% higher.
It’s worth noting: excepting the two leftmost scenarios (1.5% and 1.2%), the top 20% keep getting relatively richer than the bottom 80%. Avoiding the increased wealth concentration that we’ve seen since 1989 (or even reducing the 1989 concentration) would have required at least an annual 1.2–1.5% downward wealth transfer from the top 20%.
The very richest percentile groups, of course, might not have gotten richer with downward redistribution. It would depend on the mechanics and progressivity of the transfers. The data available here don’t let us determine that using this model. But the transfers would have to be far larger than envisioned here before top-percentile wealth levels (vs their relative share) actually stagnated or declined. Absent quite extreme redistribution, the rich keep getting richer as the economy grows. But with adequate redistribution to counter the ever-present trend toward economy-crippling wealth concentration, everybody else prospers as well.
The paper, model, data, and all calculations are available here.
Hey Steve:
I guess I should have at least scanned my Real World Economics publication since I have been a part of it since its creation. I gotta agree with you. More money in the hands of the less wealthy in assets and income will create more demand on everything. The bottom income brackets will spend as opposed to invest because they “more-than-likely have too.
A nice piece Steve.
Thanks, Run!
Just one detail in response:
> spend as opposed to invest
The operative decision is actually spend versus hold, or not-spend (or “save,” which I won’t get into the confusions associated with that term).
The decision to (vernacular) “invest” one’s holdings is just a portfolio allocation decision — utterly distinct from the decision whether to spend. Swap some M assets for equities, net zero for balance sheet, you’ve “invested.”
That’s why I’m keen on spending relative to wealth (velocity) as a measure of propensity to spend. The usual, spending relative to <i>income</i>, basically means that distribution/concentration of wealth and income <i>can’t</i> matter (much). Because “one person’s spending is another person’s income.”
So the “distribution blindness” in econ is baked right into the most fundamental foundations of econ thinking — inequality can’t matter <i>by construction</i>.
The capital gains tax preference has been redistributing wealth especially well since 1954 ended the dividends tax credit and marked the beginning of the financialization of non-financial firms, massive corporate consolidation, and unbridled securities trading for the primary purpose of making money off of money. Sure, tax and transfer is something that is better than nothing, but still insufficient to fix what we broke.
Thanks Ron, Darryl.
Yeah: the paper doesn’t touch on methods/mechanism of redistribution. They are myriad, in cash and in kind, in terms of individuals but even arguably public goods. It simply explores “redistribution” (by any method/mechanism) <i>in addition to</i> the past-30-year actual, “zero” benchmark.
Steve,
Is climate a public good? Water? Fish in the sea? If there were public investment to replace the externalized costs of mass consumption then there would be an increase in quality jobs. Higher education should be a public good because stupid people do not make a better world. I have nothing against roads and bridges. My dad built them for the state highway department when I was a kid. OTOH, a euphemism is a terrible thing to waste.
I think the answers are clearly “yes.” No duh. But in this model, it would be very difficult or arguably spurious to try and say how much of the “redistribution” from environmental cleanup/regulation goes to the bottom 80% households (for example).
It’s narrow model looking at a single economic effect based on only three (high-quality observed [or only moderately imputed/estimated]) data sets. In my opinion it would merit much elaboration (and interrogation).
The author should consider the Broken Windows fallacy of economics – https://www.investopedia.com/ask/answers/08/broken-window-fallacy.asp
The questions isn’t whether transactions will occur if redistribution occurs – its where is the most productive use of money for society. Take it from an investment (stocks t-bills) and provide it to an individual for a cable tv payment. Which is better . . .
Paul,
Broken windows is not a fallacy in the sociological context where it actually refers to broken windows and doors and falling down buildings, but the concept should not be employed in an economic or policing context where it is fallacious at best.
The commenter should explore the distinction between economists’ use of the term “investment” (spending) — paying people/firms to produce new long-lived (productive) goods — and the vernacular of that term: individuals’ net-zero swaps of their M assets for other (hopefully higher-yielding…) assets. Portfolio churn/turnover/reallocation is certainly a very important economic mechanism, but it’s importantly quite distinct from actual investment spending. The relationship between those two things is extremely complex and analytically vexed.
Obviously, the cable TV payment – or more likely a streaming payment nowadays. If you invest in a cable company, odds are they won’t spend an extra penny on anything useful. They’ll just do stock buybacks, issue dividends to people who don’t need the money and raise executive salaries. It will drive up asset prices, but high asset prices in and of themselves are not necessarily a good thing.
If you subsidize streaming, the streaming companies still get money, but only if they are fulfilling a societal need. If people really want streaming, they’ll buy streaming services. This is better than investing since having more customers with encourage and enable more investment-like spending on video production, fiber roll outs, server farms and so on. This will also drive up asset prices, but everyone gets more stuff to stream.
Interesting article. Thanks, Steve.
It occurs to me that:
Much of the increase in personal wealth of late is from stock options from such as Google, Amazon, Facebook, …, O’Reilly, …
And, that one could probably make the argument that much of the ever-increasing share for the wealthy is due to the ever lessening share being allotted wage earners
“…one could ABSOLUTELY, UNCATEGORICALLY make the argument that much of the ever-increasing share for the wealthy is due to the ever lessening share being allotted wage earners”
[fixed]
Ron:
You did not specifically mention productivity being a part.
Run,
You are correct. I did not. Productivity is found in the deep weeds of capital innovation – man vs. machine. So, I prefer not to discuss productivity without a fully gassed weed-eater.
Run,
It only takes a few minutes to take a whack with a manual hedge-trimmer, which I have now after brunch and before pool cleaning.
All else being roughly equal then productivity is just the arithmetic inverse of production costs divided by production units; a.k.a., unit production cost. Lower production costs means higher productivity. Capital can lower unit production cost by investing in technology. OTOH, capital can also lower unit production cost via the magic of financialization employed to merge with competition, which not only can improve margins, but also can allow the firm to void established labor contracts, relocate to right-to-work states, or offshore to cheaper labor pools. When all used together then machines, lower pay for workers, higher margins, and elimination of domestic work force in better paying jobs combine to reward capital for its innovations. Ask any coral reef and it will tell you that externalized costs will not be paid by capital as long as higher profits afford them first rate political access for restricting environmental regulation. The final chapter of the tragedy of the commons was financed by the rising productivity of capital; soon to be released as a major motion picture.
Of course then we can solve all our problems with a shorter work week because as everyone knows nine women can have a baby in one month :<)
There are a lot of ways that aggregate productivity can be calculated, some of which are nuts. Real GDP divided by private sector real wages is a funny way to measure productivity growth that treats increased markups and low wage offshoring as important productivity improvements.
Ron:
I did Mfg throughput and supply chain much of my work history. I am also a LSS Black Belt. I understand your commentary.
Thank you though
Aren’t you conflating unit cost with productivity? Productivity is measured in units of real output per unit of real input. Unit cost is a measure of the cost of inputs per unit of output. Private sector managers may hunk of productivity in terms of cost, but productivity and unit cost are separate, related concepts in economics.
There is certainly a compositional factor in measured productivity as less productive jobs move to lower wage areas, but that’s behavioral, not definitional.
The usual way to increase productivity in a modern capitalist society is to pay workers less and make them work more As long as workers can’t push back against wage, benefit and condition cuts, there is no economic reason to invest in capital save for worker surveillance and union busting capital.
If workers can push back, demand and get more money, then the increased spending will drive investment in machinery, corporate infrastructure, software and other productivity increasing goodies. We’ve seen this experiment. Worker power rose in the 1930s, and by the 1950s and 1960s living standards and productivity were rising. Since worker power was trashed in the 1980s we’ve seen flat and falling living standards and slow productivity growth.
This argument was more or less settled in the 1930s, and the US and much of the developed world had a good 30+ years. People bought into a lot of mumbo jumbo because it benefited extremely wealthy people by making them even more extremely wealthy. It’s high time to restart the argument and try and flush out some of the mumbo jumbo.
My understanding is that productivity, or at least labor productivity, is just output (tallied in $s) / hours worked.
As far as I’m concerned total factor productivity, TFP, is empirically intractable at best, conceptually utterly incoherent at worst. I think it’s both.
Macroduck,
Actually I was addressing the problem of generalized estimates of productivity improvement derived from economic aggregates. This widget maker knows when the plant has improved productivity as he looks at work hours per widget or cost per widget. But widget cost is specific to maker and not all widgets are created equal. Widget count cannot normalize production for the entire economy, just one product or better just one plant.
When productivity is examined from aggregate economic data then the unitizing/normalizing factor is either work hours or labor cost and the output of production is GDP. Sounds good enough until you unpack all that goes into those aggregates that we use.
Ron: Exactly right. Three words: Cambridge Capital Controversy.
Ken, you couldn’t be more correct. Basically comes down to “whaddaya mean by ‘income,’ buster?” I’ve been pounding my spoon on the highchair on this topic for years now. A pretty comprehensive explanation in my latest, here.
> ever-increasing share for the wealthy is due to the ever lessening share being allotted wage earners
Yes, certainly, by construction (and logic) really: ignoring transfers for the moment (net xfers are ~5% of HH income), the two top-level categories of household income are labor compensation and property income. If B is higher, A is lower.
To clarify:
In “slice of the pie” percentage terms, if B is higher, A is lower.
Mr. Roth,
A question or two…
Household debt has risen markedly since WWII and in particular (if memory serves) since 1980. Household spending is less constrained by income now than in the past. The source of credit to middle-class households has been wealthy households and ROW. If incomes were more evenly distributed, credit would very likely been less available. Much of middle-class borrowing has been collateralized with residential assets, so households have been spending out of (future) housing wealth. Does he model take account of the reduced access to credit implied in a more equal distribution of wealth?
Does the model take account of trade leakage? I ask because a higher level of consumption under a more equitable distribution of income is likely to mean lower net exports, which amounts to a constraint on the growth in domestic income. If the model doesn’t account for trade, the increase in domestic income and wealth reported by he model may be exaggerated, in which case he increase in consumption would also be exaggerated.
Why would credit be less accessible? Since housing wasn’t an asset class the way it is now, it was less expensive relative to wages. (Housing costs went from 600 to 800 hours in the early 1980s, and they’ve continued to rise.) That meant banks could lend money from middle and working class savers and small businesses. In contrast, rich people lent money to large corporations. There was no shortage of available credit and interest rates were affordable in the 1950s and 1960s, so I doubt a reversion to that era’s income and wealth distribution would make it harder to borrow.
Why would higher domestic consumption reduce net exports? The implication is that the US can only produce so many of a given item. Higher internal consumption combined with an increased labor share would force domestic companies to invest in increased productivity rather than simply finding cheaper labor or exporting jobs. That increased productivity would make domestic exporters more competitive in world markets. The US was a net exporter back in the 1950s and 1960s and its high wages drove companies to either become more efficient or to become net importers.
Macroduck: Interesting points and Qs.
First off on HH debt. Typically characterized as debt service costs as % of (disposable) income. Which isn’t wrong, just not a complete picture of the reality and dynamics. Leverage ratio (liabilities:assets) is also an important measure. Overall, think 15% of HH assets (less than I imagined when I went looking). And that’s been declining, especially for the bottom 50%, since The Great Whatever.
Key point: borrowing increases household assets and liabilities; it’s net zero for NW. So: “buying power”? Unclear. Ditto, whether the decline is because of credit “availability,” or something like “precautionary preferences”/risk-aversion. Some of each?
Magnitudes: The effect bruited in the paper/model (assuming counterfactual 1.5% downward annual wealth transfer over 30 years) yields an extra $8T in spending in 2019 ($22T, 52% >er than actual $14.5T). Annual change in HH debt (liabilities, and assets) runs in the (low) hundreds of $B. An order of magnitude less (and again, no NW effect).
Ditto trade deficit but more so: only $30B to $60B a year. (And very difficult to somehow “attribute” that as some (negative) part of HH income.) It’s just one of innumerable economic effects underlying and unexplained in the model’s single-effect big picture: because wealth velocity, more redistribution->more spending->more production->more wealth creation.
So yeah the model very much “doesn’t explain everything.” Inflation is missing, eg. More spending just causes more production, not price increases. But I think it reveals a pretty huge economic effect and reality that is rendered invisible by construction in “spending (saving) out of income” models. Because “one person’s spending is another person’s income,” right?
I hope this is useful… Cheers.
I see that two pasted images from that reply didn’t come through. Here:
https://www.asymptosis.com/wp-content/uploads/2021/08/Screen-Shot-2021-08-30-at-8.07.36-AM.png
https://www.asymptosis.com/wp-content/uploads/2021/08/Screen-Shot-2021-08-30-at-8.29.47-AM.png
Steve:
Are these supposed to be in your post?
Nope, just the reply.